
Martin Prado has been up and down offensively, all year. He was the NL Player of the Month for August, and deservedly so — but while his May was also quite good, his April and June were dismal. His numbers are now similar to career norms (.281/.331/.414) — but what was Prado doing differently in his recent surge?
From the first day back from the All-Star break through August 31, Martin Prado tallied 58 hits in 159 at bats with 11 walks — good for a .365 average and .423 OBP. On the back of 10 doubles (and 4 HRs), Prado had a .565 slugging mark for just the month of August.
Although I don’t think Prado’s stellar month and a half can be blamed on his being a streaky hitter, as a contact guy he does fit that mold. For the season, Prado is tied with the Brewers’ Norichika Aoki for the second-lowest swinging strike percentage (3.2%) in the majors among qualified hitters (they trail Marco Scutaro, who is at 1.4%). When Prado swings, he doesn’t miss (91.4% contact rate), particularly at pitches inside the strike zone (Z-Contact% of 96.2%).
So was he doing more with the swings he did take in August, or was he swinging at fewer pitches? Or was it both?
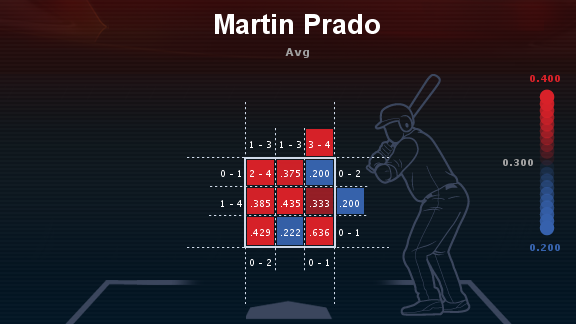
Here’s Martin Prado’s batting average for different pitch locations in August (all diagrams and heat maps courtesy of ESPN Stats & Information):
Compare that to the same map, but for the first half of the season:
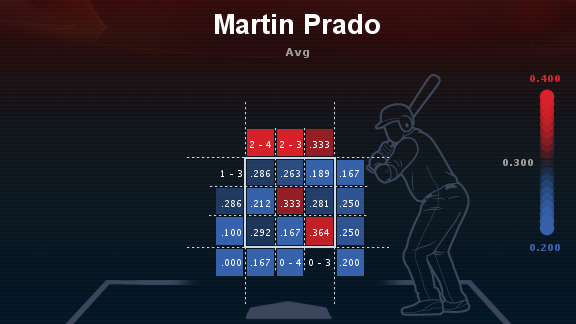
Looks like Prado was doing more with everything. Note the happy zone down and in. And if you’re looking for his slugging percentages in each part of the zone, click here for August or here for the first half.
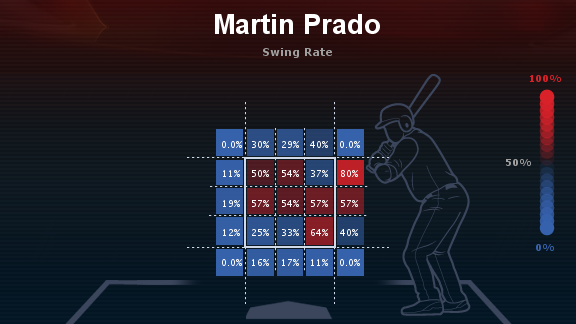
And what was Prado swinging at? In August:
And for the first half:
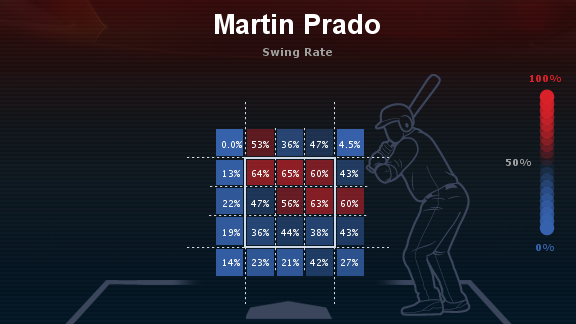
Whereas with the first pair of diagrams you might conclude that Prado was simply having more hits fall in, the swing rate diagrams above do show decreased swing rate overall.
For the season, Prado is only slightly above average in O-Swing% (percent times swinging at pitches outside the zone) at 27.9%, good for 46th among 142 qualified hitters. Z-Swing% isn’t necessarily good or bad, but Prado is all the way at one extreme among qualified hitters; he has the smallest percentage, at 53.1%. This comports with what observers take away from Prado’s at bats — he doesn’t necessarily walk a lot, but the bat stays on his shoulder pretty often.
The swing rate diagrams above don’t show a significant pattern in terms of location. So let’s look at the overall numbers, with rankings among qualified hitters (for swing rates, “highest” for rank is “fewest swings”):
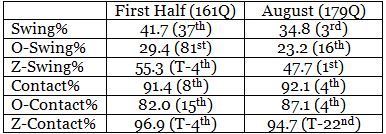
We have some sample size problems here, but we can still draw a few conclusions. Prado’s contact rate was stable in August versus the first half; a 0.7% difference is pretty small and doesn’t explain Prado’s surge. The contact percentage outside the zone grew, but shrunk inside the zone. A shrinking Z-Contact% could suggest that Prado was swinging for the fences a bit more, but this sample is too small to know that for sure.
The samples are bigger for swing percentage, and that’s where it gets interesting. Usually middle of the pack in O-Swing%, Prado laid off outside pitches at a much higher frequency. We could plausibly connect that to Prado’s August success. But what of the decrease in Z-Swing%? Prado was already extremely selective in picking his spots to swing at pitches inside the zone for the first half. Tied for fourth, he was something of an outlier — and one might have been tempted to blame Prado’s selectivity for his struggles.
Somehow, even though he struggled while laying off an unusually high number of pitches within the zone in the first half, the answer for Prado was not to be less selective with zone pitches, but to be more selective — Prado swung at zone pitches a ridiculously low 47.7% of the time. There was an enormous gap between Prado and second place on that scale — Matt Carpenter and David DeJesus were tied for second at 51.2%.
To put that in perspective: in 2011, zero qualified hitters had a Z-Swing% of under 50 last year. In 2012, there was only one.
His name? Martin Prado. Swinging at only 48.9% of pitches inside the strike zone, Prado was 17% better than the average hitter at creating runs last year (wRC+ 117). Low swing rates are Prado’s calling card, and it works for him. So much so, that after swinging infrequently early this season wasn’t working out, maybe all Prado had to do was do a more extreme job of being himself.
If you enjoyed this article, please consider sharing it!


2 Responses to Swinging Even Less Has Powered Martin Prado’s Surge
Leave a Reply
@ryanpmorrison
 Congrats to @OutfieldGrass24 on a beautiful life, wedding and wife. He deserves all of it (they both do). And I cou… https://t.co/JzJtQ7TgdJ,
 - Best part of Peralta’s 108 mph fliner over the fence, IMHO: that he got that much leverage despite scooping it out… https://t.co/ivBrl76adF,
 RT @OutfieldGrass24: If you're bored of watching Patrick Corbin get dudes out, you can check out my latest for @TheAthleticAZ. https://t.co/k1DymgY7zO,
 - Of course, they may have overtaken the league lead for outs on the bases just now, also...
But in 2017, Arizona ha… https://t.co/38MBrr2D4b,
- Prior to the games today, there had only been 5 steals of 3rd this season (and no CS) in the National League. The… https://t.co/gVVL84vPQ5,
Powered by: Web Designers@outfieldgrass24
- I’ll never forget seeing Kyle Seager at the Scottsdale Fashion Square one March with his family and thinking “damn,… https://t.co/uapNYdsU2a,
- Big dogs. Bigger trees. @ Avenue of the Giants, Nor Cal https://t.co/YAdxcE1t1p,
- Old friend alert https://t.co/7HQjiyBWTB,
- Death wish https://t.co/XJzcMkNPTy,
- Feeling cute might delete https://t.co/NyqGSXVOwQ,
Powered by: Web Designers

This is fantastic! Love the heat maps as they really help visualize the issue. Watching Prado in the first half stunned me, as I felt like he was chasing a lot and no making nearly as much contact as I had expected given his past in Atlanta. Good to see he’s back to his own ways and hopefully he continues to mash for the rest of the season and all of 2014.
I feel like I just read a really long math problem