
An 81-81 team overall, last season the Diamondbacks actually did quite a bit better as series progressed. In games 1 of individual series, Arizona’s winning percentage was just .442 (23-29). In games 2, it rose to .510 (26-25). And in games 3 or 4 of series, the team was a real winner (.543 W%, 32-27). That advantage may not seem significant, but consider this: when the D-backs were playing a team for the third game of a series, the team was playing a third game, as well. The winning percentage for all teams in baseball in games 3+ was exactly .500 (891-891).
The difference in winning percentage between the first two games of a series and games 3+ was, for the D-backs, 0.066. That discrepancy was the seventh-highest in all of baseball, and second-highest in the NL (for reasons I’ll return to in a moment, the AL may have had an advantage in interleague series that was specific to game 3s). And if the D-backs had been able to keep up the .543 winning percentage for all games, the team would have won 88 games, instead of 81. An 88-win season would have been more fun than the 81-win season (by, oh, 7 days at least), but it is true that last season, 88 wins still would have meant missing the playoffs… unless some of those extra wins came at the expense of the Reds or Dodgers.
So on to the big question: why? Was the D-backs’ late-series advantage pure luck, or something repeatable?
At Beyond the Box Score yesterday, I published a study on late-series winning percentage and whether there was a connection to Pitches Seen (total number of pitches seen by a team’s hitters) or at least to P/PA (pitches per plate appearance). The findings were modest, but I think there’s something there. There are two main things that drive up a team’s Pitches Seen: On Base Percentage (the more batters that get plate appearances, the more total pitches), and P/PA, which is just a measure of how selective a team’s hitters were. With respect to the D-backs, there is another driver of Pitches Seen, of course: having the second-most extra innings of any team, all time. Not all pitches are made equal, but I do think Pitches Seen is a decent stand-in for abusing a pitching staff. And in 2013, the D-backs were sixth in baseball in Pitches Seen with 24,283 — less than 50 pitches behind the New York Mets (I know, surprising), who were the top NL team in Pitches Seen.
To be perfectly candid, I can only think of two reasons why a team might fare better late in series than early in series. One is luck. The other is that Pitches Seen or some factor like that might have a sort of cumulative effect as series wear on; as I wrote in the Beyond the Box Score article, it stands to reason that if it’s helpful to abuse a pitching staff to win today’s game, it might be more helpful to have abused a pitching staff for a third consecutive day.
Before jumping in on that single non-luck explanation, we should be clear: that last “if” is not a trivial one. The times through the order penalty (TTOP) makes all starting pitchers more hittable as they cycle through the lineup (think 10 points of OBP per cycle, or so). So while it’s conventional wisdom in baseball that it’s great to knock out a starter early to get to a team’s soft underbelly of middle relievers, that advantage may actually be negligible, and it could really depend on the identity of the relevant pitchers.
If the D-backs succeeded in knocking opposing starters out of the game a little more often than other teams, and if seeing the relievers that entered instead were an advantage, than we would expect that advantage to show up in the D-backs’ average runs per inning for innings typically pitched by middle relievers. Here’s a table of average runs per inning, for MLB, the NL, and the D-backs, as well as the difference between the D-backs’ averages and the NL averages:
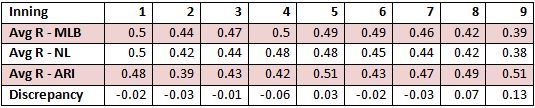
Arizona’s total runs scored were only slightly above average (and keep in mind they scored runs in extra innings), but its average runs per inning were quite close to the NL averages, almost across the board. The uptick in the 9th inning is significant, but that doesn’t fit the theory that a greater number of Pitches Seen causes a hitting team to have more success in innings 6-8. The average runs per inning for the 8th inning looks notable on the surface, but overall, the D-backs saw a 0.06 total runs per innings advantage over the rest of the NL anyway, and a .07 advantage in any particular inning only adds up to a 11 run advantage over the course of a season. Not much here.
So let’s scrap the idea of the Pitches Seen benefit as a bump in success in middle relief innings, and return to looking at what happened overall. Trying to investigate a connection between the D-backs’ late-series winning percentage and its high Pitches Seen total is not so much a consequence of a high P/PA ratio — that really wasn’t a factor for Arizona, because combined, D-backs hitters saw 3.82 P/PA, barely above league average (3.80). The extra innings were clearly a factor in the D-backs’ high Pitches Seen total, but the club’s .323 OBP (league average was .315) was mainly responsible.
The problem is that, as I found in the BtBS article, OBP has no relationship whatsoever with any kind of ability to win more late-series games than early-series games (the correlation coefficient around 95% was -.029, which is effectively chance). P/PA may have shown a weak relationship (.189), but, again, the D-backs were essentially average in P/PA. So it comes down to Pitches Seen (.154), and in games 3+ of series, if there’s been a cumulative effect from extra innings, that’s a benefit that the opposing team gets to enjoy, too.
Ah, but what about when the extra innings game in the last game of a series? In those circumstances, the D-backs may have had trouble in the following game, with their staff put through the ringer and the opposing team’s staff a little more fresh. If that’s the case, it could be less that the D-backs had an advantage in late-series games, and more that the team had a disadvantage in many of its early-series games.
That may be a partial explanation, actually. The D-backs had 24 extra-inning games, but a disproportionate number of those 24 came in the last game of a series (14). That’s 14 different times that the D-backs were coming off an extra inning game when their opponent was not. And of those 14 games following end-of-series extra inning games, the D-backs went 5-9. It passes the smell test for me that it would be harder to win when you’re more exhausted than your opponent. But other than that little wrinkle, I think it was nothing but chance.
If you enjoyed this article, please consider sharing it!


@ryanpmorrison
 Congrats to @OutfieldGrass24 on a beautiful life, wedding and wife. He deserves all of it (they both do). And I cou… https://t.co/JzJtQ7TgdJ,
 - Best part of Peralta’s 108 mph fliner over the fence, IMHO: that he got that much leverage despite scooping it out… https://t.co/ivBrl76adF,
 RT @OutfieldGrass24: If you're bored of watching Patrick Corbin get dudes out, you can check out my latest for @TheAthleticAZ. https://t.co/k1DymgY7zO,
 - Of course, they may have overtaken the league lead for outs on the bases just now, also...
But in 2017, Arizona ha… https://t.co/38MBrr2D4b,
- Prior to the games today, there had only been 5 steals of 3rd this season (and no CS) in the National League. The… https://t.co/gVVL84vPQ5,
Powered by: Web Designers@outfieldgrass24
- And he's pulled. Not a good outing, and now the injury. Didn't look arm-related. Seemed more lower-body in nature. https://t.co/SscHvfqhx6,
- Gallen to the ground after that delivery. Not good.,
- Zac Gallen's fastball command thus far has been inconsistent to put it lightly,
- If you're a @HillsboroHops fan, you should be following Greg https://t.co/OZtJ4DSD1e,
- Old friend alert https://t.co/MYeDuoKxM8,
Powered by: Web Designers
