
In 161 plate appearances since returning from the DL, Mark Trumbo has just one home run. We checked in with the stats and injury analytics expert Stuart Wallace in search of an explanation.
It’s not that Trumbo has been terrible at the plate since his return — his .254 average is actually better than his .248 career mark. It’s that his .324 slugging percentage is well below the .460 percentage he’s had for his career, turning Trumbo’s one-dimensional game into a no-dimensional game.
We’re dealing with a stretch of the season that’s less than two months, and in that small a sample bad luck good explain Trumbo’s lack of home runs. And although Trumbo worked out his swing before his rehab assignment — including standing in against a rehabbing Daniel Hudson — rust could also be to blame, considering the eight week length of his layoff and just 26 plate appearances in the minors by way of a tune-up.
Lingering effects of the stress fracture in the third metatarsal of his left foot might also have something to do with it. I reached out to injury analyst Stuart Wallace to find out how the injury could affect Trumbo’s performance at the plate. If you aren’t acquainted with Wallace’s work at Beyond the Box Score and other sites, you should be; check out this analysis of D-backs favorite Ryan Braun‘s hand issues and this piece on the knee injuries of Carlos Gonzalez and Garrett Richards. Here’s what Wallace had to say when asked whether Trumbo’s stress fracture could partly explain his power outage:
Yes, and it can explain the lack of power along with his previous bout with plantar fasciitis. The lead foot is a critical cog in the kinetic chain, with the lead leg transfer of power generated by the lower half up to the upper body and into the swing. Mechanics-wise, the front foot strides out, allowing for the closing of up of his hips, and a weight shift of nearly 100% to the front leg. From here, the front leg firms up, allowing his hips to rotate towards the ball and accelerate rapidly in order to get his hands through the swing plane. In the follow-through phase of his swing, rotation of the hips continues, with all of his weight completely transferred to the lead leg and foot, with the leg at maximal extension, and swing deceleration continues. The fasciitis and stress fracture arising from it prevent the above from really being initiated completely, with pain and tenderness of the area potentially leading to Trumbo being apprehensive and slow to get his front foot down with any authority, thereby creating a weak anchor point for the kinetic chain, creating less power and bat speed.
Without talking with Trumbo, it’s not possible to know whether he’s still feeling pain (he was playing through the plantar fasciitis in April), or whether he might be trying to keep pressure off the foot while swinging without fully realizing it. But it’s clear from Wallace’s comments that the injury could be at least a partial explanation.
It does seem like something is going on. Check out this spray chart, courtesy of ESPN Stats & Info:
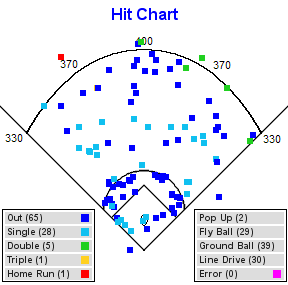
Compare with this first half spray chart:
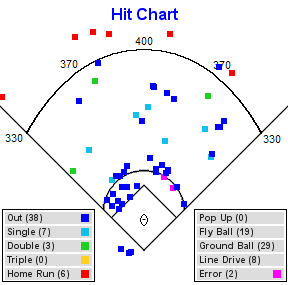
Part of the difference is just number of plate appearances, with just 96 represented in the second chart for the first half, and 152 for the second half. But whereas Trumbo was very feast-or-famine in the first half, with dozens of ground outs and a healthy smattering of long fly balls, he’s really peppered the outfield since the All-Star Break. Those long fly balls in the second half that either went for doubles or died on the warning track could be balls that may have gone over the fence — if Trumbo’s power has really been sapped by the foot injury. And for what it’s worth, Trumbo’s spray chart from 2013, which has many, many more balls in play, looks to me a lot more like Trumbo’s April than his recent results.
Said differently, Trumbo is actually hitting fly balls just fine; his fly ball rate of 35.6% in March/April increased to 38.9% in July and to 40.6% in August. None of these figures are far from his career FB% of 38.2%. But while Trumbo is hitting fly balls, he doesn’t seem to be hitting them very far.
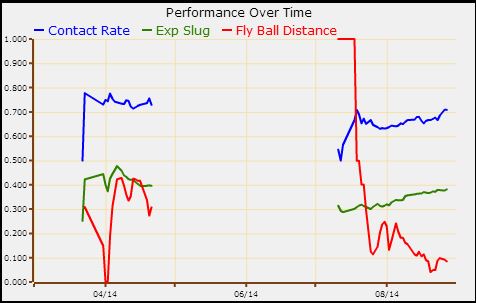
The average distance of Trumbo’s fly balls in the first half was 298 feet. In the second half? Just 264 feet. From this ESPN Stats & Info graph, check out how his fly ball distance has changed over time this season, compared to a contact rate that has stayed pretty consistent after a brief hiccup upon his return:
What makes this really unusual is that nothing much else has changed for Trumbo; his K rate in the second half (24.3%) is actually a bit better than his first half (27.1%) and career marks; his walk rate has also improved a bit. It’s really that drop in slugging.
“Isolated Power” is calculated by subtracting batting average from slugging percentage, and it can be a good window to peer into power differences like the one we’re interested in now. Trumbo’s second half ISO is just .075. Compared to his .212 career mark (which includes the last two months!), that’s pretty bad.
So is it rust? Using July/August splits to try to pick up on a rust factor:
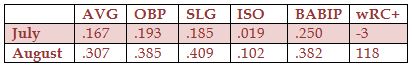
Trumbo definitely struggled upon his return. He was just terrible across the board; that wRC+ mark means he was creating runs at a rate 103% worse than league average for non-pitchers. But while significant, the discrepancy between July and August doesn’t explain away Trumbo’s power loss. A .102 ISO looks worse than it probably really is, because of Trumbo’s abnormally high batting average in the month. But the .402 slugging percentage for August is still a healthy drop from his .460 career rate, and there is the small matter of hitting just one home run in the month despite historical HR/PA rate that would have him hitting just over one bomb per week.
There is also some reason for optimism, and for thinking that Trumbo could be the victim of bad luck, at least in August. ESPN Stats & Info calculates a “Hard Hit Average” stat (HHAV). Trumbo’s HHAV in 2013 was .186. For July of this season, Trumbo’s HHAV was .109; in August, it’s up to .209. Hitting the ball with some authority isn’t necessarily the same thing as hitting it a long way, but those numbers are some indication that what was wrong with Trumbo in July isn’t necessarily wrong now.
Chances are, the full explanation for Trumbo’s power outage is a combination of things: bad luck in August, and lingering issues with his foot that made shaking off the rust of his layoff more difficult in July. For what it’s worth, Steamer’s rest-of-season projection for Trumbo is a .464 slugging percentage, while the comparable ZiPS projection sees a .487 SLG. But given that the plantar fasciitis was an issue previously, and given that the size of the sample continues to grow, it’s going to be interesting to see whether Trumbo actually does start hitting long fly balls again.
Many thanks to Stuart Wallace for his injury analysis. Wallace is an Associate Managing Editor at Beyond the Box Score, and a contributor at Camden Depot, Gammons Daily, and District Sports. Follow him on Twitter: @TClippardsSpecs.
If you enjoyed this article, please consider sharing it!


2 Responses to Explaining Mark Trumbo’s Power Outage
Leave a Reply
@ryanpmorrison
 Best part of Peralta’s 108 mph fliner over the fence, IMHO: that he got that much leverage despite scooping it out… https://t.co/ivBrl76adF,
  RT @OutfieldGrass24: If you're bored of watching Patrick Corbin get dudes out, you can check out my latest for @TheAthleticAZ. https://t.co/k1DymgY7zO,
 - Of course, they may have overtaken the league lead for outs on the bases just now, also...
But in 2017, Arizona ha… https://t.co/38MBrr2D4b,
- Prior to the games today, there had only been 5 steals of 3rd this season (and no CS) in the National League. The… https://t.co/gVVL84vPQ5,
- RT @OutfieldGrass24: Patrick Corbin has a WPA of .318 and it's only the fifth inning.,
Powered by: Web Designers@outfieldgrass24
 RT @joshuamckerrow: 1. Today I did the annual story on holiday decorations at the Governor's residence. I've done it every year, for ye… https://t.co/s7JnlHM1RO,
 - This Suns matchup comes at a good time for my hometown Blazers #RipCity https://t.co/fQ45wdfQUk,
 RT @ZHBuchanan: Our @Ken_Rosenthal spoke to Ken Kendrick about trading Paul Goldschmidt.
https://t.co/O5fHRlyBxD,
RT @ZHBuchanan: Our @Ken_Rosenthal spoke to Ken Kendrick about trading Paul Goldschmidt.
https://t.co/O5fHRlyBxD,  RT @CardsNation247: We have a good show lined up for tonight. Leading off is our friend of the show @buffa82 followed by Jeff Wiser… https://t.co/eltZC0uvyg,
  RT @juanctoribio: To piggyback off the @ZHBuchanan and @OutfieldGrass24 that the #Rays were involved in the Paul Goldschmidt sweepsta… https://t.co/spg9x7X1L5,
Powered by: Web Designers

makes sense, bat speed and ball speed off the bat, should also be apparent in this struggle. so hopefully he’s hurt. He appears to have a better swing and approach now though, so once fully healthy he will probably become better. He was needed to carry this line up and run produce, when goldy went out, his lack of production killed this team. He stunk it up instead, offensively and defensively. team record reflects it.
That’s the main problem with a one-dimensional player: you don’t have anything if that part of his game disappears. At least some of the contact-oriented guys like Inciarte would give you some value on defense either way.