
As Jeff wrote yesterday, the chances that Yasmany Tomas ends up at third base seem to have taken a dive of late as more scouts have seen him – and his perhaps “limited mobility” – in action. But as Jeff Passan noted when the report issued, the D-backs are the same team that doggedly refuse to see Peter O’Brien as anything other than a catcher, the same team that plans to use the defensively-challenged Mark Trumbo in right field instead of left despite the likelihood that more balls will be hit to right.
When defense is a matter of bad hands or throws, it’s not that hard to see – it sticks out when a player drops a ball or tosses one into the stands. And right then and there, it seems like we can trace those kinds of plays (usually, errors) to specific players scoring, and maybe even to whether or not the team picks up a win or a loss. It’s not that simple, of course – some of those players would have scored anyway. Some of the throws were rushed on purpose on 50/50 chance plays, with the cost of missing (a runner at second with two outs, perhaps) nowhere near as important as the value of getting the ball to first on time (an out).
And there is still the matter of range, which is much more difficult to see. Route-running can be tough to follow, especially if the players’ problems come mostly in the split second before anyone is really paying attention to him. And acceleration is underrated – at least, I think so (we should know by the end of this year!). If you think you can internalize all of those things while properly weighting the effects of each on runs scored, you’re completely crazy, and probably wrong. But that’s why we have numbers. It’s no different than batting average, really – just as we wouldn’t rely on our memories of a player’s past plate appearances, we ought not to rely on stilted impressions of a player’s defense. There is no reason to rely on memory alone, with or without impressions on ability – numbers are here to help. That’s okay.
It’s all relative. In baseball, what we care about most are the things we know for sure that have a big effect, like on base percentage, like first pitch strikes, and like catcher (or catcher/pitcher) framing. Sometimes there are things we know for sure that don’t have a huge effect – like how a team’s top three hitters should bat first, second and fourth (not third!). How many runs do the D-backs lose by having Goldy third instead of second or fourth? Maybe two runs per season. Boo hoo.
Sometimes we have the problem that is the total opposite – things we really don’t know for sure, but which have a large effect. That’s the case with pitching in many respects. But it’s also the case for defense.
As Jeff has written and as we talked about with respect to Ultimate Zone Rating and Defensive Runs Scored, advanced defensive statistics are at least partly a matter of inference. Didn’t make that play? Okay. But should he have? How many other right fielders would have made that play?
What I want to do here is give us a frame of reference for comparing some of the possible defensive alignments for the D-backs this year. It’s not that hard to figure out which ones are better, but it’s harder to figure out by how much. We’re also going to see if we can start to figure out how much the alignments might affect some pitchers differently than others, based on how frequently the pitchers actually put the ball in play (strikeouts and walks? Defense not as important), and where the ball usually goes (extreme fly ball guy? Maybe outfield defense has a larger effect here than for other pitchers).
This is absolutely not exact, for many of the same reasons why projections are not exact. Projections like ZiPS and Steamer are not very precise. They are, on average, only within about 0.80 runs on ERA. But that’s not the same thing as saying they aren’t accurate. Picture a dart board. It’s not like the projection systems are constantly missing four inches to the right and up from the bullseye; if they were, their creators would change their model and the darts would fall on the bullseye and be both precise and accurate. Instead, projection systems are like really bad dart throwers. They miss all over the place – in fact they miss by an average of 8 inches from the bullseye (the 0.80 runs). But they are nonetheless accurate, because while the bullseye may be far from a lot of the darts, it is solidly in the middle of them. It’s not hard to see what everyone was aiming at.
The fact that projection systems are only that accurate is a testament to the human element in the game. Please don’t take it upon yourself to reject this whole thing because you disagree with the accuracy of one of the numbers used (“Trumbo will be better in right field because he’s more comfortable!”). That would, as Tom Tango once put it, make you the least interesting person in the world.
Instead, take this for what it is: a problem-solving tool. Will having Tomas at left instead of third lower the staff ERA by an entire run? Well then he sure as hell better not play third, right? But if the difference is almost nothing at all, we can agree that we all should worry more about getting the right bats into the lineup.
Here are the six defensive alignments I’m going to use. I’m ignoring catchers for this exercise completely, especially since the D-backs aren’t exactly brimming with choices. And while catchers affect games in many more ways than just framing and blocking, I really don’t want to confuse those skills with what we’re looking at here.
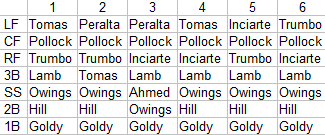
See how a few of those guys are playing two different positions? Here are the defensive “ratings” I’m going to make up and define myself. Trust me. I’m a junk scientist. But really, this is based on my impression and recent and projected advanced defensive stats, with a pinch of Tango’s Fans Scouting Report results for flavor.
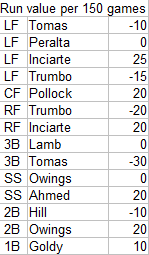
Feel free to disagree. This is about the concept more than the specifics, although maybe we have enough information to take some sides on which alignments we can and can’t live with.
Walking through how I applied my process for every pitcher is not all that interesting, and it would take forever. But just so the process isn’t a black box: I used the combined FIP projections for each pitcher at FanGraphs (ZiPS and Steamer) as a starting point for some of the important starting inputs, like strikeout rate, walk rate, and batted ball rates. I thought about using a custom HR/FB for D-backs pitchers, but reasoned that that was already factored into the FIP projections as HR rate overall. As for the effect of defense, I retrieved outcome percentages for each pitcher (types of batted balls in play, as well as K, BB, other). I made a custom BABIP for each batted ball type for each defensive alignment, and used the difference between those and league average for each batted ball type, weighted for each pitcher’s batted ball tendencies, to take the FIP projection and turn it into a mock RA9, which is just ERA but with unearned runs included just like earned runs (we are measuring the impact of good or shoddy defense, after all). The result is a subpar projection, as compared to the ZiPS and Steamer originals — but doing it this way should give us an accurate read on the difference that defensive alignments make, if not a perfect guess as to actual runs allowed. Phew.
Using the projected innings pitched at the FanGraphs depth charts page and the numbers above, this is how the rotation RA9 would shake up for each defensive alignment:
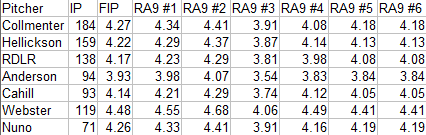
Yeah, so… yeah. Some interesting things going on here: the Tomas/Trumbo outfield in alignment #1 does more to Collmenter and Hellickson than to the other starters (in a bad way), and the Tomas/Pollock/Inciarte outfield in #4 helped Collmenter out a bit more than the other pitchers. But it’s pretty consistent across the board; I was expecting defensive strength or liability in the outfield or infield to affect the fly ball and ground ball guys more differently. Instead, it’s really just one lesson: good defense is good defense. And it’s largely about who can get there for line drives.
Have a different defensive alignment to run? Drop me a line, and I’ll run the numbers and put them in one of the next few roundups. I could also be persuaded to run one with a meaningfully different defensive “score” for one or more of the defenders.
If you enjoyed this article, please consider sharing it!


2 Responses to Quantifying the Effect on Pitching of D-backs Defensive Alignments
Leave a Reply
@ryanpmorrison
 Best part of Peralta’s 108 mph fliner over the fence, IMHO: that he got that much leverage despite scooping it out… https://t.co/ivBrl76adF,
  RT @OutfieldGrass24: If you're bored of watching Patrick Corbin get dudes out, you can check out my latest for @TheAthleticAZ. https://t.co/k1DymgY7zO,
 - Of course, they may have overtaken the league lead for outs on the bases just now, also...
But in 2017, Arizona ha… https://t.co/38MBrr2D4b,
- Prior to the games today, there had only been 5 steals of 3rd this season (and no CS) in the National League. The… https://t.co/gVVL84vPQ5,
- RT @OutfieldGrass24: Patrick Corbin has a WPA of .318 and it's only the fifth inning.,
Powered by: Web Designers@outfieldgrass24
- Every once in a while you get a beer that's just a little off... Usually happens to me at airports.,
- If Pollock doesn’t sign with a team that wears red uniforms I’m going to be really disappointed. Working theory: Se… https://t.co/zHn9DqzEiD,
- The work here by @Britt_Ghiroli is splendid https://t.co/c8tSq0vw3T,
 RT @TheAthleticAZ: Plenty of #Dbacks fans gave it some time - and they still don't like the idea. The "why" from @ZHBuchanan
https://t.co/9oDlvue3fV,
RT @TheAthleticAZ: Plenty of #Dbacks fans gave it some time - and they still don't like the idea. The "why" from @ZHBuchanan
https://t.co/9oDlvue3fV,  RT @CardsNation247: Episode 30 of the Cardinals Nation 24/7 Podcast, Hosts @ToR_Ron75 & @JMRedwine welcome @buffa82 of @KSDKSports &… https://t.co/7dbIEzcahN,
Powered by: Web Designers

0.4 runs per game difference between the best and worst defensive combinations is pretty significant. Now you need to show that side by side with how much of an offensive difference those 6 combinations project to be, to see if you get back the 0.5 runs with more offensive production, but somehow I doubt it.
This was already on the fringes of reality, and so I’d have a hard time trying to make confidence levels for both offense and defense close enough for me to present something like that with a straight face.
The difference here was definitely significant, but unrealistically so. RA9 was the only way to go, here, but the range of ERAs would probably be tighter together, since errors would affect the bad-defense alignments (deflating those RA9s) more than the good-defense ones. It’s also unrealistic to present this as if the same alignment could play in front of any pitcher all year, and since (at least on this roster) the exceptions for the good-defense alignments would tend to be bad-defense replacements and the exceptions for the bad-defense alignments would tend to be good-defense replacements, that would also reduce the difference. And finally and most significantly: these defensive numbers are patently unrealistic. Individually, I think I could defend each of them as within reason — but taken together… it’s just pretty unlikely that all of my defensive “ratings” would actually happen, and where they’d be off, they’d be much more likely to be closer to the middle.
Maybe I’m looking at this the wrong way — it could be easier to look at this from the perspective of a single game, with a nameless “League Average” opposing pitcher on the mound and a specific D-backs starter expected to pitch the whole game. I think we’re more used to seeing most of these numbers as based on a season (0.067 defensive runs per game!), but it would be an easier way to do expected runs scored and expected runs allowed, side by side.
What we really need is a simulator that does something meaningful with defense. I’ll ask around.