
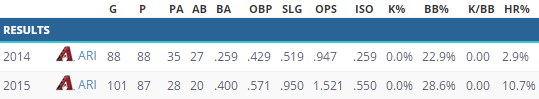
Pop quiz, hot shot: can you name these two D-backs players based on their slash lines? It’s almost the same number of PA, so the comparison seems to work.
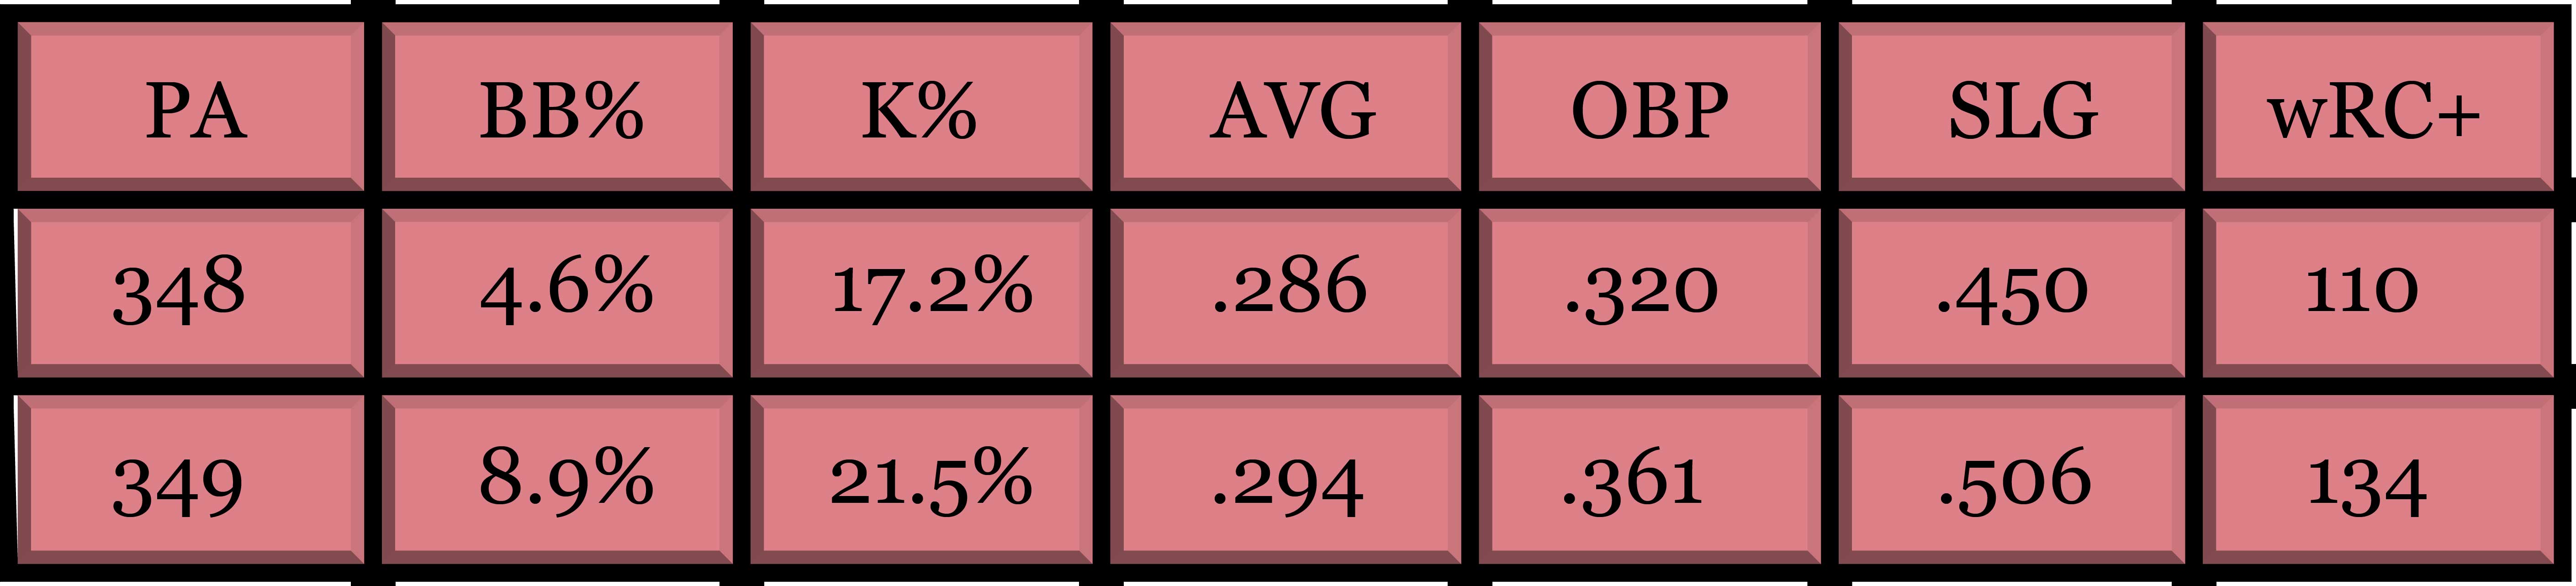
No? Well, what if I told you that the first line was a product of facing opposite-handed pitching 77% of the time, and the second, 83% of the time? Just from that, you know we’re talking about lefties. Toss in the headline, and David Peralta probably isn’t too much of a leap.
The other one is also Peralta: the first line is his 2014, and the second his 2015, where he has just reached a new career high in plate appearances. The lines aren’t overwhelmingly different — it has a good year/very good year vibe — but the profile is also a bit different. That’s a pretty big jump in walk rate, all things considered, a difference between 16 and 31 walks. It gets better.
Peralta’s 442ft HR last night had a batted ball velocity of 115mph — second fastest this year (thanks, @darenw!). pic.twitter.com/16oAWDgKWv
— Ryan P. Morrison (@ryanpmorrison) April 8, 2015
Peralta isn’t just sporting an average exit velocity on line drives and fly balls of 96.21 mph, good for 13th among the 280 players with at least 100 tracked balls; he’s crushing pitches early in the count. We can probably infer that he is completely unleashing like in the above GIF in hitting .448 in 0-0 counts:
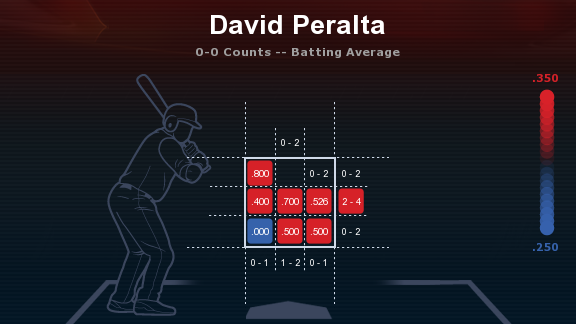
Oh, and slugging .816. That’s where Peralta is doing his most damage, putting the ball in play 87 times out of those 349 PA on the first pitch. After that, Peralta gets smartly conservative, more and more as the at bats progress. Compare Peralta’s swing rate in 0-0 counts to all other counts:
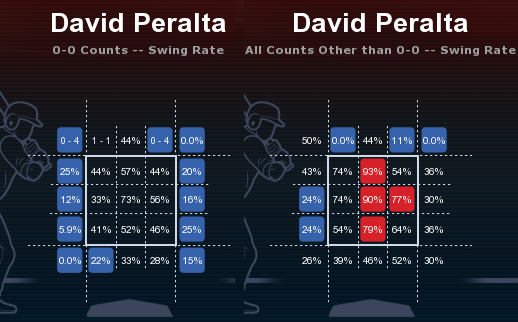
Give Peralta something he likes to hit as the first pitch, and he’ll be all over it. After that, Peralta appears to zero in on the middle of the plate (horizontally), not caring quite as much if it’s up or down. That stands out the most with respect to the pitches he’s gotten with 3 balls — which is an impressive 116 different pitches, over 72 PA. Only 40 of those 72 PA ended with Peralta putting the ball in play; he appears to swing only if the pitcher forces him to by throwing right down Broadway.
This is an approach that Peralta has developed this year; he’s much more aggressive than the average hitter early in the count, at least with respect to how hard he swings the bat, but he is almost a statue once he gets you deep in the count. In full counts this season, Peralta has an on base percentage of .518; he walks 41.1% of the time. The walk total is good for a share in a five-way tie for 26th place in baseball last season.
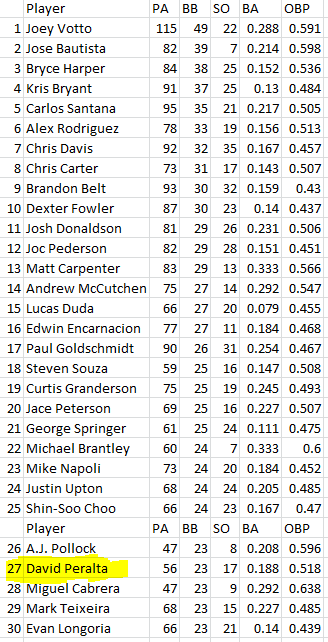
Other than Miguel Cabrera and one other familiar face, everyone else in the top 30 has quite a few more PA than DP (well, Steven Souza isn’t too far off — and Souza bears quite a few similarities with Peralta, actually). If I limit the data to the 93 players with at least 50 full count PA, Peralta ranks 14th in OBP with that .518 mark. Not bad. Because remember how Peralta took that jump up in walk rate this season? This is where it’s from. It’s not that Peralta is doing dramatically better in full counts overall — he still had an OBP in his 32 full counts last year of .500 — but he’s erring on the side of watching this year. Last year, it was about hitting well in full counts (.333). This year, it’s about taking his walks (41.1%, up from 25%).
How Peralta actually gets there may be the most interesting story. It’s no longer a matter of pouncing all over any strike if Peralta gets well ahead in the count (3-0, 3-1, 2-0). From ESPN Stats & Info:
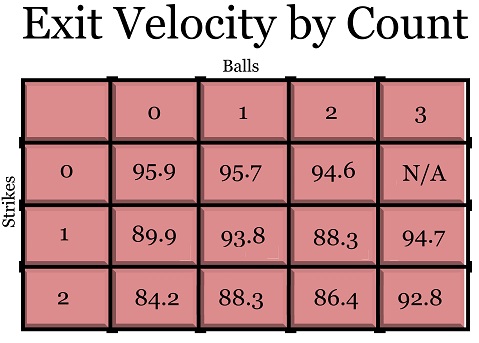
Good hitters can do good things in counts that friendly, but maybe great hitters do great things. Anyway. We don’t have batted ball velocity data from last season, but we do have enough of it this season to start to notice some overall trends in hitters’ approaches. Take these exact numbers with a grain of salt — some have just 5 batted balls, and there are no tracked 3-0 balls — but take it as a hint at when Peralta fully unleashes that monstrous swing.
If you enjoyed this article, please consider sharing it!


@ryanpmorrison
 Best part of Peralta’s 108 mph fliner over the fence, IMHO: that he got that much leverage despite scooping it out… https://t.co/ivBrl76adF,
  RT @OutfieldGrass24: If you're bored of watching Patrick Corbin get dudes out, you can check out my latest for @TheAthleticAZ. https://t.co/k1DymgY7zO,
 - Of course, they may have overtaken the league lead for outs on the bases just now, also...
But in 2017, Arizona ha… https://t.co/38MBrr2D4b,
- Prior to the games today, there had only been 5 steals of 3rd this season (and no CS) in the National League. The… https://t.co/gVVL84vPQ5,
- RT @OutfieldGrass24: Patrick Corbin has a WPA of .318 and it's only the fifth inning.,
Powered by: Web Designers@outfieldgrass24
- Old friend alert https://t.co/xwSHU0F8Hn,
- Every once in a while you get a beer that's just a little off... Usually happens to me at airports.,
- If Pollock doesn’t sign with a team that wears red uniforms I’m going to be really disappointed. Working theory: Se… https://t.co/zHn9DqzEiD,
- The work here by @Britt_Ghiroli is splendid https://t.co/c8tSq0vw3T,
 RT @TheAthleticAZ: Plenty of #Dbacks fans gave it some time - and they still don't like the idea. The "why" from @ZHBuchanan
https://t.co/9oDlvue3fV,
RT @TheAthleticAZ: Plenty of #Dbacks fans gave it some time - and they still don't like the idea. The "why" from @ZHBuchanan
https://t.co/9oDlvue3fV,
Powered by: Web Designers
