If Things Go Wrong
After a tour around the 70th percentile projections for D-backs players earlier this week and scaling them back to get them to the right playing time levels, we saw between 13 and 14 wins of “reasonably optimistic” room over and above the PECOTA-based projection of 78 wins this year from Baseball Prospectus. But what about the other direction? Is it a hard floor not too far below the 78 win mark, or more of a quagmire?
One very big thing complicates that question that wasn’t a problem for us with the 70th percentile numbers: playing time. The playing time numbers we used were the ones used at the BP depth charts for the weighted mean PECOTA projections in the first place; if the guys getting the most playing time would get that playing time with the performances actually expected, it stood to reason that they would get at least that much playing time if they were doing better than expected. The reverse is not true for all of those players.
Only the D-backs Powers That Be know just how mediocre some of the back end players would need to be before they entertained pulling the plug, and the extent to which that threshold could be changed by good performances by the players that would probably be next in line (for the rotation, Archie Bradley, Zack Godley, Tyler Wagner or even Braden Shipley are all projected to make starts this year by BP). And as noted in working through the position player outcomes, Yasmany Tomas would probably only see his playing time somewhat reduced, at worst—but there are lots of options among option-able players in the middle infield, and less reason to hesitate to make changes.
Just as there’s an especially high chance that some of the start-worthy middle infielders outperform projections, there’s an especially low chance that all of them will underperform those projections. But let’s take a look at 30 percentile PECOTA projections, and then try to figure what the real floor on this season would be.
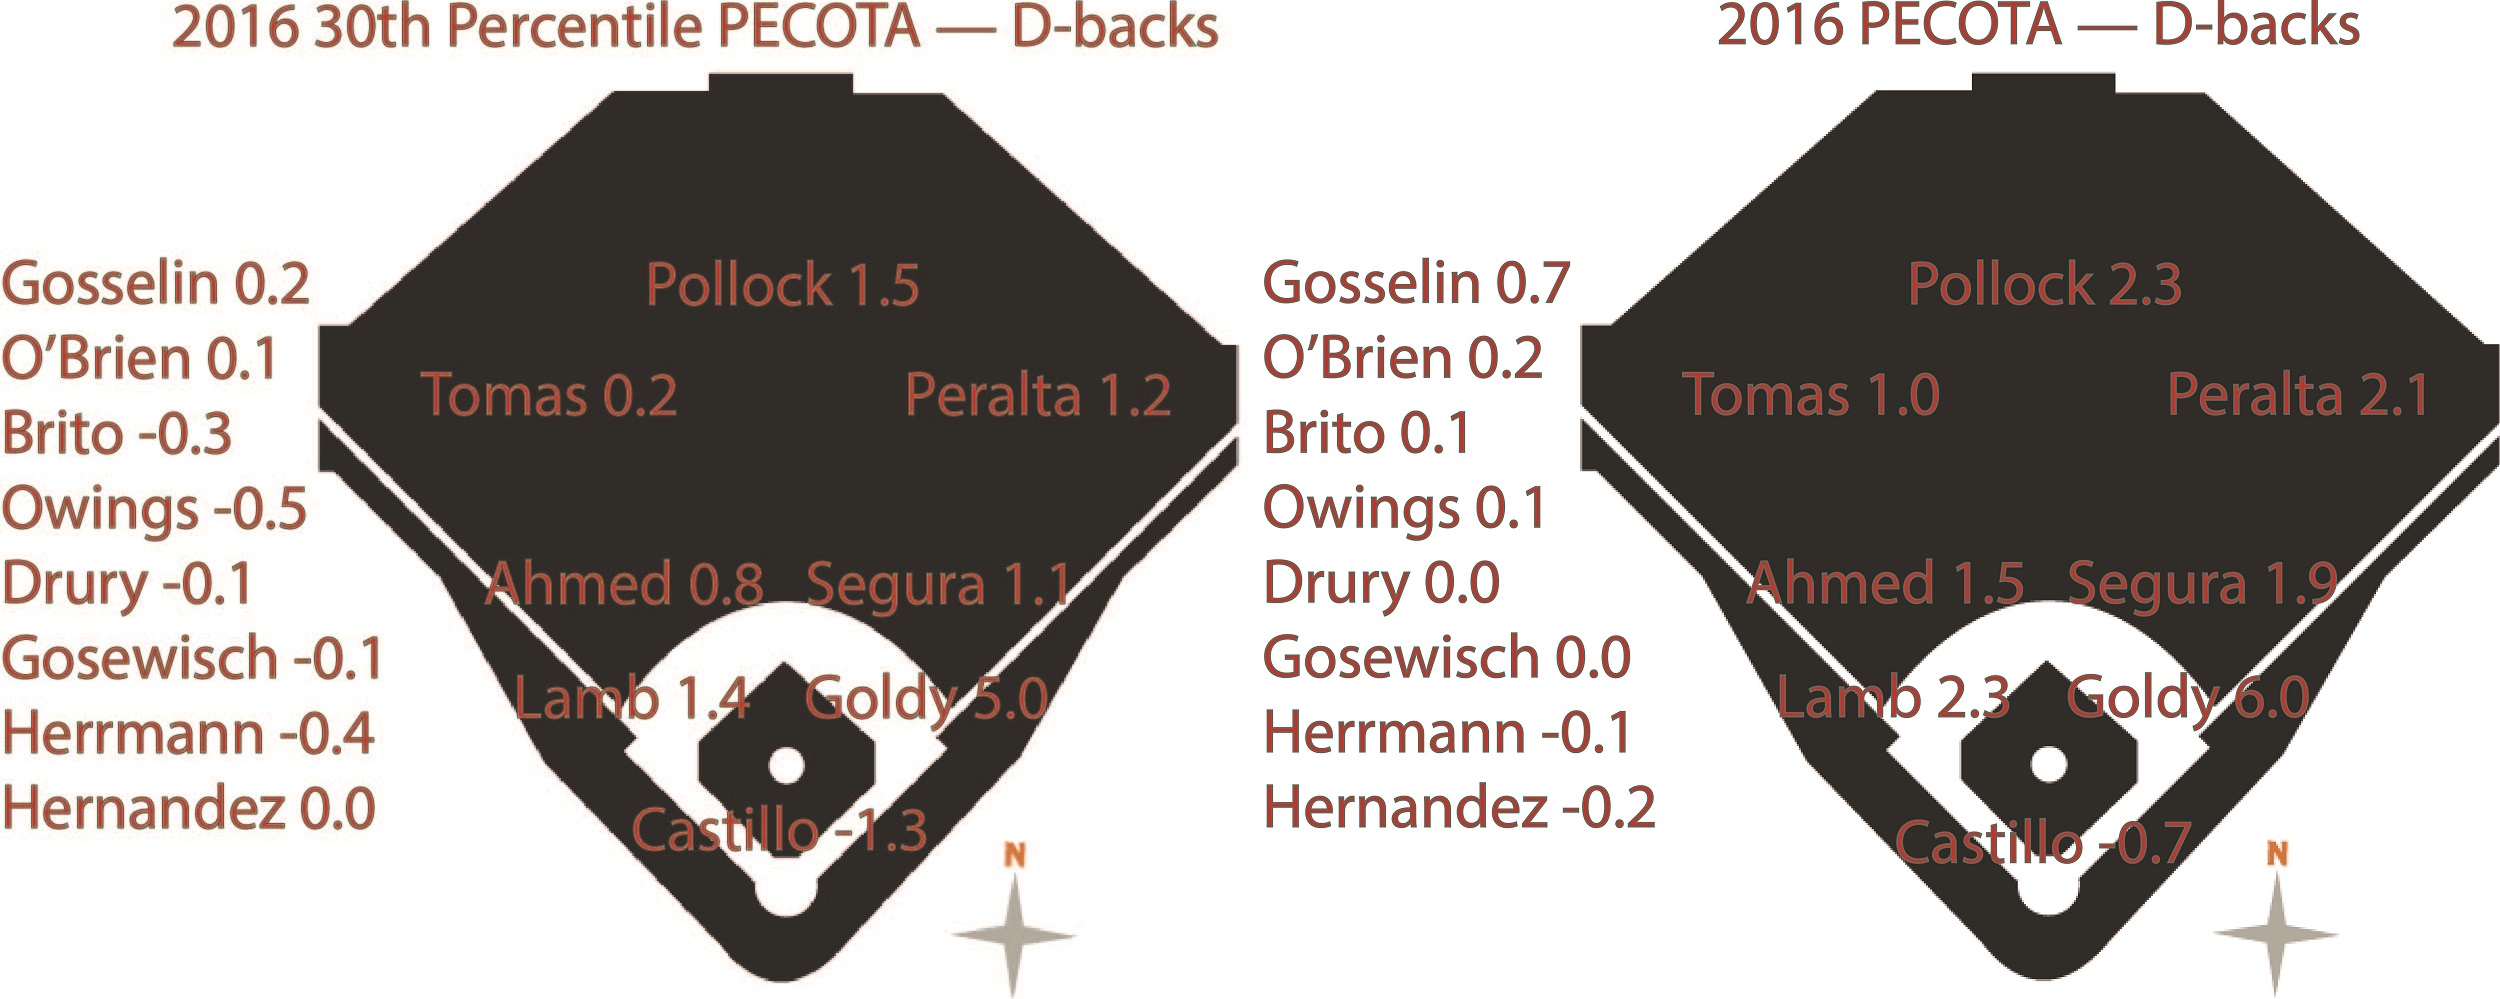
The position players:
Goldy doesn’t far too far, and even if we have reservations about A.J. Pollock‘s projections overall, this wouldn’t make him a substantially different player. Jake Lamb is still the team’s third best position player here, but really there’s a whole lot of below average performances (with average for a starting player probably between 1.5 and 2.0). Moreover, a lot more of the bench depth goes from being vaguely helpful to being a liability — especially if you consider that Oscar Hernandez‘s projection only goes up because he’d be playing less in a 30th percentile situation.
All we can really take from this is an idea of the number of players that the team might end up being motivated to replace on the roster. If Chris Owings or Socrates Brito or Chris Herrmann underperforms somewhat, they become significant negatives. Left field would become a very obvious spot for an upgrade, which might end up meaning an injection of some left-handed platoon help. Catcher, though, would become a black hole threatening to cancel out an otherwise solid performance elsewhere on the diamond. The D-backs may never see Welington Castillo this way, even if he ends up close to the 30th percentile outcome — they just haven’t looked as much at defensive statistics for catchers, framing being king of them all. But if PECOTA is to be believed, Castillo has the potential to put a big dent in the team’s playoff hopes, all by himself.
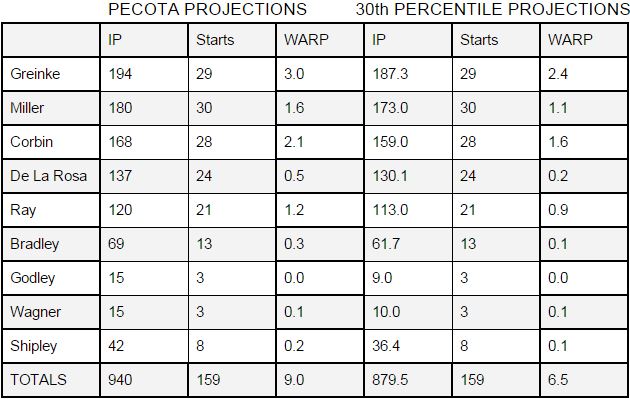
Rotation:
Not much to see here — every starter is just a somewhat worse version of himself in these projections, with everyone making the same kind of drop, proportionally. Notably, of the top five starters here, four have 30th percentile projections that still look better than any of these four replacements on the depth chart. Even if Ray ends up being fairly bad, he’s still adding three times the wins of Bradley in less than half of the innings. It’s just Rubby De La Rosa who has a “bad, but realistic” projection that would prompt replacement, and even that projection is above replacement level.
Maybe the other main takeaway would be that struggles from Zack Greinke, Shelby Miller or Patrick Corbin all have about the same potential to put a dent in the team’s playoff hopes. Greinke has the biggest effect on the season, but in terms of likely outcomes, struggles from him doesn’t do much more to the win column than struggles from the other two players would. It’s extremely unlikely that all of these 30th percentile outcomes would happen, but it’s also worth noting that if they did, an extra 60 or so innings would be needed from the bullpen.
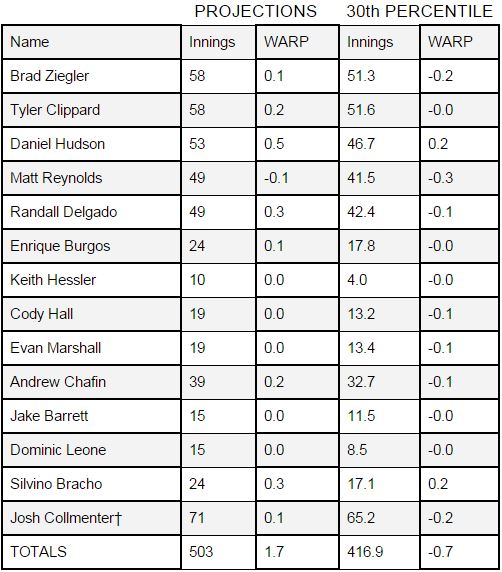
And, finally, the hot mess that would be the relief crew:
Holy hell. PECOTA is probably way too unkind to the bullpen in general, if only because it seems way too unkind to Brad Ziegler (who has WARP totals of 0.9 or better in each of the last five seasons). Once you stare closely at the 30th percentile numbers, though, the WARP numbers that get spit out are a testament to how volatile bullpens really are. Err a little, and you’re suddenly on the wrong side of replacement level. From the 30th percentile numbers, it seems like we learn that the only relievers who are very likely to be better than replacement level are Daniel Hudson and Silvino Bracho — probably with that Ziegler caveat again.
Some of the relievers would be replaced more quickly than others. If Tyler Clippard lands at -0.0 (either those numbers are rounded off, or “negative zero” is a real thing that I just wasn’t aware of), it’d be a lost opportunity to add value — but it wouldn’t be so bad that the team would need to step in and make a very difficult decision to write off some $10M-$12M dollars in Clippard payroll. Ziegler and Hudson are also probably especially safe. Josh Collmenter‘s low number seems especially unlikely, given how great he was once he was returned to the bullpen again, but even steady performer Randall Delgado has a sizable chance to slip below replacement level, it seems. In addition, it sure seems like Matt Reynolds would need to put together a great spring to justify having him on the Opening Day roster in the first place.
The key takeaway from these numbers is that rostering a bullpen is a very hard game to play, probably — there’s just no way to know in advance which of these pitchers will prompt the team to replace them before the team runs them out there. In addition, the projections on the left are probably more likely to be indicative of June-September performance than stats in April or May could be (unless we could point to some change, like a dip in velocity, maybe). I’d add this, though: Silvino Bracho looks like one of the three or four surest bets to add value in the bullpen this year, and unless he looks really pretty bad in March, it’s hard to come up with a reason he shouldn’t be on the roster in April.
***
You wouldn’t be surprised to hear that, as constituted with the numbers above, the D-backs would not make the playoffs if all of their players hit their 30th percentile projections. Without any other adjustment, the team’s PECOTA-based projection for the season would fall from 78 wins to down between 69 and 70 (still better than their worst-in-MLB total of 64 in 2014). As noted above, though, several of the 30th percentile projections take a particular player below replacement level. Would “should replace this guy” help ameliorate that drop in losses at all?
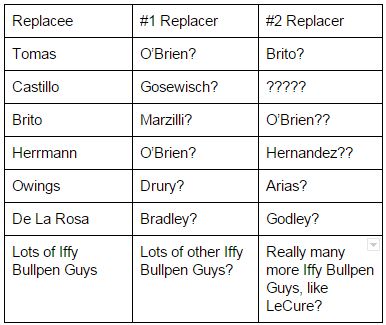
Maybe not as much as it normally would. The D-backs shoved their chips to the middle of the table this offseason, and that included a cost in depth. In the rotation, Archie Bradley may not necessarily be available — and the #7 starter wouldn’t necessarily be an upgrade over even Rubby De La Rosa, should RDLR land on a pace to get to his 30th percentile projection. That’s the price of losing Chase Anderson, maybe. Here’s a review of the replacement-worthy players from the 30th percentile projections above, with their most likely replacement, and a backup option:
That shouldn’t be terrifying — it’s not like very good players are normally waiting in the wings for most teams most of the time — but it probably should be scary. The only positi0n players on the sidelines that are projected for above-replacement performance and eligible for more playing time (i.e., not necessarily Phil Gosselin) are Brandon Drury and Peter O’Brien, and they aren’t projected that much higher than replacement, even taking playing time into account. It seems like there’s a decent chance that Tomas struggles, but O’Brien wouldn’t necessarily be better than a struggling Tomas. The same goes for Nick Ahmed (whose replacement could be Drury, through Jean Segura), and we’ve already talked through the starting pitcher cliff that the team now has. In addition, the team will always have more bullpen arms it can use — it had Plans A through D in place even before Clippard was signed — but the deeper it reaches into that depth, the even more uncertain it will be that the options they grasp for will actually help. Overall, if all of the 30th percentile projections are coming to pass with the team’s starting players, they probably can’t do much more than get one or two wins back by replacing those players, and even then that would take some luck.
The 30th percentile projections adjust playing time to some extent, but it does not drop off — they do not account for injury, but only for how bad a player could end up being if given the expected share of playing time. The starting pitchers’ projections do see an innings drop, for example, but not starts. Injuries will happen, and if this exercise has taught us anything, it’s that the team isn’t necessarily well equipped to handle them. Still — the likelihood that all of the 30th percentile projections happen is close to zero, and the number of unfairly unfavorable projections (Ziegler, Miller, Greinke, Pollock?) might be higher than the number of unfairly favorable projections (RDLR? Maybe Shipley?). I still think we’re significantly more likely to see a win total over 78 than below it this season, but even a normal dose of bad luck seems likely to make the playoffs a difficult proposition.
2 Responses to If Things Go Wrong
Leave a Reply Cancel reply
Recent Posts
@ryanpmorrison
 Best part of Peralta’s 108 mph fliner over the fence, IMHO: that he got that much leverage despite scooping it out… https://t.co/ivBrl76adF, Apr 08
 RT @OutfieldGrass24: If you're bored of watching Patrick Corbin get dudes out, you can check out my latest for @TheAthleticAZ. https://t.co/k1DymgY7zO, Apr 04
 Of course, they may have overtaken the league lead for outs on the bases just now, also...
But in 2017, Arizona ha… https://t.co/38MBrr2D4b, Apr 04
 Prior to the games today, there had only been 5 steals of 3rd this season (and no CS) in the National League. The… https://t.co/gVVL84vPQ5, Apr 04
 RT @OutfieldGrass24: Patrick Corbin has a WPA of .318 and it's only the fifth inning., Apr 04
Powered by: Web Designers@outfieldgrass24
 RT @CrashStL: We have a good guest list for tonights @CardsNation247 Podcast. Joining @_ChrisLollis and @ToR_Ron75 will be… https://t.co/BSwCRpaGVk, 33 mins ago
 RT @JohnStolnis: Hittin' Season #237 is here!
@Mike_Ferrin talks me into A.J. Pollock and bums me out that he doesn't think Robbie… https://t.co/wyEbHLeDBL, 1 hour ago
 RT @JonHeyman: Reds are among teams pursuing AJ Pollock and Dallas Keuchel, 1 hour ago
 RT @OutfieldGrass24: ICYMI, I posted my #DbacksMinors top-10 prospects yesterday. You can find those rankings and the entire top-30 here: https://t.co/zOJeYnBrnk, 2 hours ago
 RT @HillsboroHops: 6 of the top 10 Diamondbacks prospects are former Hops. 👀👀
#AllHoppedUp https://t.co/uwx488BKMK, 2 hours ago
Powered by: Web Designers


The biggest thing that could go wrong for the D-Backs is injuries.
In 2014, the main contributor to the D-Backs last place finish were significant injuries to the D-Backs two best players… Goldschmidt and Pollock…
With the D-Backs trading away so many prospects, the number of MLB-ready replacements in the D-Backs farm system is pretty small. This could be a problem if the any of the D-Backs key players has a significant injury.
If the D-Backs are going to succeed this year, they are going to have to stay healthy…
Obviously, all D’backs will not drop to the 30%. It wil be a mix of projection, 30%, 70%, and 90% plus other actual performance. You can’t possibly run down all these potential permutations in this article. But, just as the D’backs were ruthless in the off-season, so too they should be ruthless during the season. That means replacing a few who might be trending early on, toward the 30% with replacements who have the potential in your 70% and 90% projections. Because the replacement isn’t guaranteed to put up 30% projections.
1). Castillo -0.7 projection trending to -1.3 at 30%
Replacement options: Gosewich 0.2 at 70%, 0.6 at 90%
or Herrmann 0.3 at 70%, 1.0 at 90%
2) RDLR. 0.5 projection trending toward 0.2 at 30%
Replacement options: Bradley 0.8 at 70%, 1.4 at 90%
or Shipley 0.5 at 70%, 0.9 at 90%
3). Tomas. 1.0 projection trending to 0.2 at 30%
Replacement options: Brito 0.6 at 70%, 1.4 at 90%
or O’Brien 0.5 at 70%, 1.1 at 90%
4). Reynolds. -0.3 projection trending toward -0.1 at 30%
Replacement options: Burgos 0.3 at 70%, 0.5 at 90%
or Marshall 0.2 at 70%. 0.3 at 90%
So, I think the D’backs have replacements that would blunt worst case scenarios that could sabotage their season. Injuries to key performers, as David-Phoenix says above are a greater risk to sabotage the season.