
We have a full magazine of projections, now, with Baseball Prospectus publishing their PECOTA numbers earlier this week. It’s a lot to look at all at once, and it’s far from gospel — the projections all seem to be strangely low on A.J. Pollock, for example. One of the great features of PECOTA, however, is that in addition to the “mean” projections we see bandied about, the system also spits out a range, all the way from a 10th percentile projection (a 90% chance the player does better) to a 90th percentile projection (a 90% chance the player does worse). On this most wonderful of days—D-backs pitchers and catchers report day, with Spring Training officially open—what can we learn from what PECOTA sees as the best case scenario for the team?
In keeping with the theme of the day, let’s get a look at what PECOTA thinks of the pitching staff, using this projection of playing time. “We” expect Zack Greinke, Shelby Miller, Patrick Corbin, Rubby De La Rosa and Robbie Ray to be the team’s starting five in terms of innings, with Archie Bradley and Braden Shipley combining for 21 more starts and Zack Godley, Tyler Wagner and Josh Collmenter mopping up another 9.
Before proceeding, it’s important to note: the way PECOTA works, it’s taking those depth charts numbers at their word in terms of starts and appearances. Ray’s 10th percentile projection is 21 starts — and his 90th percentile projection is 21 starts. Within that, though, his innings do change based on the quality of the outcome, from 103.2 innings (4.9 innings/start) to 137 innings (6.5 innings/start). The fact that playing time doesn’t change makes an exercise like this one a little easier, at least for the starters. We’ll circle back with the innings total later.
The Rotation: An Optimistic Look
If I could put 70th percentile into words, it would be “reasonably optimistic.” Unless PECOTA is way off in some way—not particularly likely, given over a decade of tweaks—the idea is that about half of the “mean” projections will be over, and about half will be under. The D-backs front office almost definitely does not believe that it has guaranteed any particular win total this year, but it could rightly think that it has secured a chance at making a strong showing at the playoffs. For a mid-to-low market team like the D-backs, a “reasonably optimistic” projection can still be a very important exercise: even if things go mostly right, where will we be?
A damn fine rotation, that’s where. In descending order of Wins Above Replacement Player:
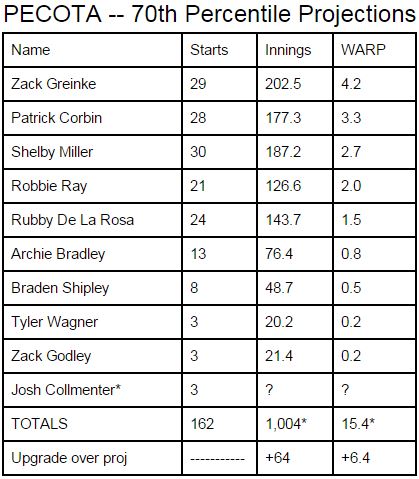
*As I can’t separate Collmenter’s 3 projected starts from his other 50 projected appearances, I’ve treated his totals as “zero” throughout.
The team’s WARP projection for these starters is 9 even, and this would be a tremendous outcome for the team. With the possible exception of Shipley, there’s not one outcome above that makes me think “no, that really can’t happen.” Among pitchers who got more than a few starts in the majors last year, only Corbin, De La Rosa and Bradley would be improving on their 2015 seasons if they posted the WARP totals above. Thoughts:
- The true shock here would probably be De La Rosa, as he finished last season with -0.8 WARP, and this would be an enormous improvement. Rather than dismiss the above number out of hand, though, remember: PECOTA is a deep thinker. This is some indication that RDLR’s peripherals are given to a heady range of outcomes, and the potential that he might be a 2 to 1 bet to make the changes necessary to become a truly productive starter.
- Huge range for Greinke, from 1.2 WARP at the 10th percentile to 5.5 WARP at the 90th. Consider that that swing has very little to do with playing time. Is there a real chance that the bottom could fall out this early? His 30th percentile totals are 187.3 innings and 2.4 WARP, making his “reasonably pessimistic” outcome a similar quality to what we saw out of Ray last year (scaling up for innings). Miller is not too far behind, though, and in some ways his (slightly smaller) range is “bigger,” as at the high end, Miller is essentially an ace (4.0 WARP), and at the low end Miller is below replacement level (-0.1 WARP).
- PECOTA is really, really high on Corbin, if you think about it. Sure, a big chunk of this is playing time—PECOTA is handcuffed with that 28 starts total, and if Corbin really does start that many games, it’d likely be because he was pulled early from several starts. But it’s not just that. Corbin’s excellent 2013 season weighed in at 2.9 WARP, with 208.3 innings — a lot more than what we have here. In that context, even the 2.1 WARP projection that PECOTA actually gives Corbin as a weighted mean is a really strong showing; that would be doing nearly as well in 28 starts as Corbin did with a similar number of innings in 2013. And if 3.3 WARP in just 28 starts is “reasonably optimistic,” then it’s “reasonably optimistic” to say Corbin could be better than he was in 2013, and not by a little.
With some innings caveats we’ll get back to, this 70th percentile set of outcomes for the D-backs would increase their PECOTA-based win total projected at Baseball Prospectus from 78 wins back above the .500 threshold (remember how hard that was last year?) to 84 wins. Not too shabby. But what if things really went well?
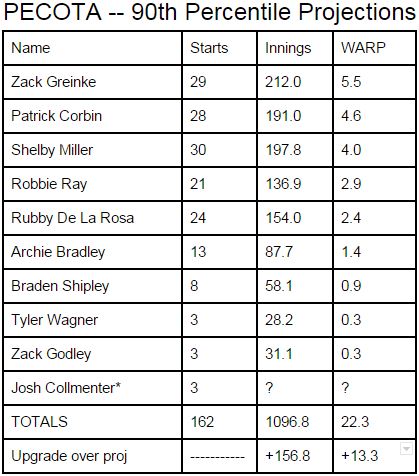
Whoa — at this point, the innings increase would put a pretty serious dent into the WARP total we’d expect from the bullpen. Without that subtraction, though, this is one hell of an addition: enough to raise that 78 win projection to 90 wins. PECOTA is pretty soft on some of the top position player performers, and so with a little give and take, you can start to see what a playoff version of the 2016 D-backs would look like. Thoughts:
- This Corbin WARP total is hard to imagine. He was aces in 2013, but even before things fell off a cliff in late August of that season, he really wasn’t this good. And while I really do think that nearly 3 WARP for Ray is a possible outcome, it’s also really, really hard to imagine that happening in just 21 starts. Fingers crossed; if Ray found a way to put away more batters and avoid some of those foul balls, he could be a 6+ inning starter with regularity, instead of the 5+ inning guy who barely ever topped 6 on one day. Also, Rubby De La Rosa? There’s being optimistic, and then there’s…not. We can’t rule out 2.4 WARP for RDLR, but it’s the same thing with Ray: just can’t see it in that number of starts.
- On the other hand, who are we to rule out the Greinke and Miller 90th percentile outcomes here? Greinke finished last season with a 7.6 WARP, a full two wins better than this 90th percentile outcome. He’s only topped 3.5 WARP three times in his twelve seasons in the bigs, but when he’s done it, he’s really done it: 7 WARP in 2009 for Kansas City, 4.8 WARP in 2012 for Milwaukee and Los Angeles/Anaheim, and that epic 7.6 WARP total last year for the Dodgers. Chase Field is not Dodger Stadium, but the latter wasn’t the pitcher haven in 2015 that it has been in most seasons, thanks seemingly in part to an equally epic drought. 5.5 WARP may not be especially likely, but it passes the smell test—and in looking at the 70th percentile numbers farther above, it gives you some reason to think that if some numbers are definitely high, there might be some give going the other way, too.
- We probably can’t overstate Miller’s potential to do a lot better than his weighted mean projection of 1.9 WARP. Seasons like the 2015 that Greinke just had are probably resolved for thoroughly dominant strikeout artists (read: Randy Johnson) and power pitchers with finesse (read: Curt Schilling), and maybe Greinke is the latter. Miller probably isn’t; if he can pitch like a top of the rotation starter, it’s going to be by being a contact manager like he was in 2015 with a changed repertoire, as Jeff explored on Monday. We have a reason to think that the 2015 version of Miller is more representative of what may come next than his 2014 (or strong 2013, for that matter), and this 90th percentile figure of 4.0 WARP is still a fair bit lower than his 4.6 WARP last season, even accounting for the difference in starts (33 in 2015).
The Bullpen: An Optimistic Look
If we’re talking range of outcomes, there might be nothing wider than the number of innings that the D-backs bullpen will contribute in 2016. Last year, the team’s relief crew blew the freaking doors off of the previous franchise record for innings pitched, with a robust 579.1 innings, more than 50 more innings than the D-backs’ previous high water mark. As things stand, the depth charts on which the PECOTA numbers are currently based has the bullpen sitting at 503 innings, a total that would have ranked just 17th-highest in 2015. That’s already expecting a lot to go right—a lot of it has to do with Greinke pitching essentially a full season—and if you forced me to make a bet, I’d still take the over on relief innings. The chances that all three of Ray, RDLR and Bradley all get closer to 6 innings/start than 5 innings/start doesn’t seem that strong, and as noted above, the depth charts’ total for Corbin (168 IP) also seems unlikely.
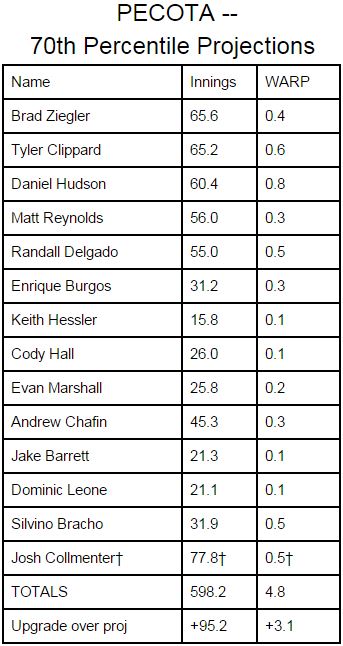
†I’m crediting all of Collmenter’s innings as relief innings, although the depth charts have him starting three games.
Right off the bat: this is way too many innings. I think the depth chart is also more than a little off here, too; with considerations like options, it is possible that Bracho won’t start the year with the big club, but even PECOTA has Bracho with the lowest ERA of this group (3.16 ERA; next lowest is Daniel Hudson, at 3.50). You can’t keep a good man down. I’m also incredulous that Reynolds will stay in the bullpen all year, and that Chafin’s innings are at all more likely to be limited as compared to the top arms. That said, though, some thoughts:
- In a 70th percentile setting, it’s not like everyone gets their innings cut by a sixth; maybe Brad Ziegler and Tyler Clippard don’t get that far beyond 60 innings, but it’s the Dominic Leone and Cody Hall and Keith Hessler and Jake Barrett innings that drop off, maybe even completely. So while this 70th percentile projection doesn’t actually mean an extra 3.1 wins, it might still mean an extra 2.5.
- What does Ziegler need to do to get some respect up in this joint? There may be reason to believe that a downtick in velocity would not hurt Ziegler’s results as much as it would other pitchers, and so while a repeat of his 2.0 WARP performance last year isn’t especially likely, an aging curve doesn’t bring him all the way down to the 0.1 WARP projection currently given him as a weighted mean by PECOTA. In every one of the last five seasons, Ziegler has totaled at least 0.9 WARP. In a rosy projection, shouldn’t we at least start there? BP’s wins metric is very, very nuanced, as it’s based on Deserved Run Average now, which is very, very nuanced (hence Miller’s shiny 4.6 WARP last year). I don’t think it quite takes into account everything that Ziegler brings to the table, however, particularly his penchant for extra outs through ground ball double plays. No one is guaranteeing great health for 2016, but if we’re not discounting any reliever’s totals for health reasons, even this 70th percentile projection seems weirdly low.
- What we just said about Ziegler also may apply to Clippard, to some extent — and that makes sense, given his status as “Bizarro Ziegler.” Clippard hasn’t dipped below 1.1 WARP since 2008. Ya got me? There’s definitely more risk here from aging than with Ziegler, as Clippard’s extreme vertical movement could become… less vertical if gravity gets more time on each pitch to do its work. Unlike with Ziegler, that doesn’t mean more of the good things, as Clippard’s fastballs could end up finding the middle of more bats. Still, this is supposed to be a fairly optimistic look at what to expect. In that context, a full win seems more than reasonable.
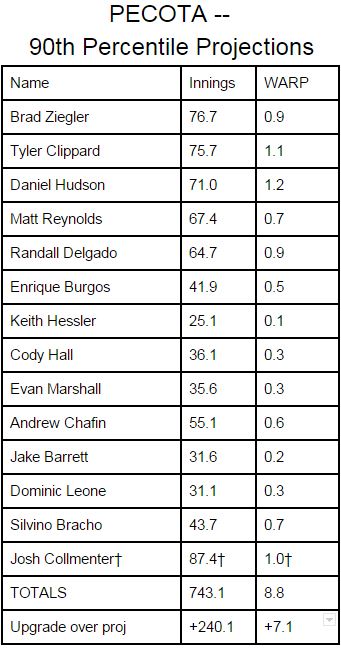
Thoughts? For me, it’s more of the same, except that our innings adjustment has to be much, much more drastic. It’s hard to see Ziegler, Clippard and Hudson attaining these innings levels unless there’s just not enough help to go around—which is not the “way too many innings” scenario we’re looking at here. In both sets of projections, Hudson’s numbers are the kind of thing I was expecting (“reasonably optimistic,” and then “as optimistic as possible”). Still, we can take some value lessons from the above. Silvino Bracho has that potential to be worth a full win in a full season, and Collmenter probably can do this well as a reliever, and there is some support in the numbers for the naked possibility that Randall Delgado and Matt Reynolds could really do a lot of damage here.
Before we turn to the position players tomorrow, we should take away something about what a 70th percentile picture of the D-backs pitching staff could look like overall. From the bullpen, it seemed like just over 4 wins was definitely possible in a “reasonably optimistic” scenario, even at 503 innings. Even that discount on innings, though, doesn’t comport with our 15.4 wins number from the starters: that’s a total of 1,507 innings, and most teams last year pitched 1,440 to 1,465 innings (although the D-backs did have the second-highest total, with 1466.2). Our “reasonably optimistic” staff would pick up 0.6 wins per 50 innings or so, and while once again the lost innings would probably have been going to the iffiest relievers, let’s just knock that off. Our “reasonably optimistic” total is 18.8 WARP from the pitching staff.
That, my friends, would be a 8.1 win upgrade from the current PECOTA projection, enough to up our 78 win “thanks for trying” season to a “hey look, maybe we made the playoffs” 86 wins. If we find out from looking at the position player side of things that the end of our “reasonably optimistic” exercise that there’s some room for growth, a squad with a probable shot at the playoffs is at least possible.
If you enjoyed this article, please consider sharing it!


5 Responses to If Things Go Right: D-backs Pitchers
Leave a Reply
@ryanpmorrison
 Congrats to @OutfieldGrass24 on a beautiful life, wedding and wife. He deserves all of it (they both do). And I cou… https://t.co/JzJtQ7TgdJ,
 - Best part of Peralta’s 108 mph fliner over the fence, IMHO: that he got that much leverage despite scooping it out… https://t.co/ivBrl76adF,
 RT @OutfieldGrass24: If you're bored of watching Patrick Corbin get dudes out, you can check out my latest for @TheAthleticAZ. https://t.co/k1DymgY7zO,
 - Of course, they may have overtaken the league lead for outs on the bases just now, also...
But in 2017, Arizona ha… https://t.co/38MBrr2D4b,
- Prior to the games today, there had only been 5 steals of 3rd this season (and no CS) in the National League. The… https://t.co/gVVL84vPQ5,
Powered by: Web Designers@outfieldgrass24
- Starting 2022 with a frigid dog walk sounds just lovely https://t.co/xoLZSZBpGp,
- I’ll never forget seeing Kyle Seager at the Scottsdale Fashion Square one March with his family and thinking “damn,… https://t.co/uapNYdsU2a,
- Big dogs. Bigger trees. @ Avenue of the Giants, Nor Cal https://t.co/YAdxcE1t1p,
- Old friend alert https://t.co/7HQjiyBWTB,
- Death wish https://t.co/XJzcMkNPTy,
Powered by: Web Designers

So PECOTA is way more fun to say than Steamer or ZiPS…
On a less stupid note (hopefully), do you think Matt Reynolds pitches more than Chafin? He did have a really good 2013 season, but also struggled last year coming back from TJ surgery.
Tuffys health will be a major key to the staff,hopefully by june he is capable of full time.
The 70th percentile for starters looks more than reasonable. I might be less optimistic on RDLR than the projections but I’m more optimistic that Bradley can cover the difference. I think Greinke will fall somewhere between his 90th and 70th and think the Corbin, Miller guesses are spot-on. Ray should pitch more than 150 innings. The bullpen numbers are too weird to get anything from. I’m pretty confident with all of the options and maybe a dead-line addition the bullpen will contribute 5 wins of value to the cause.
[…] If Things Go Right: D-backs Pitchers Double Plus: More Chip Hale Looks Like a Good Thing […]
[…] line (for the rotation, Archie Bradley, Zack Godley, Tyler Wagner or even Braden Shipley are all projected to make starts this year by BP). And as noted in working through the position player outcomes, Yasmany Tomas would […]