One-Run Games Have Altered the Diamondbacks’ Franchise
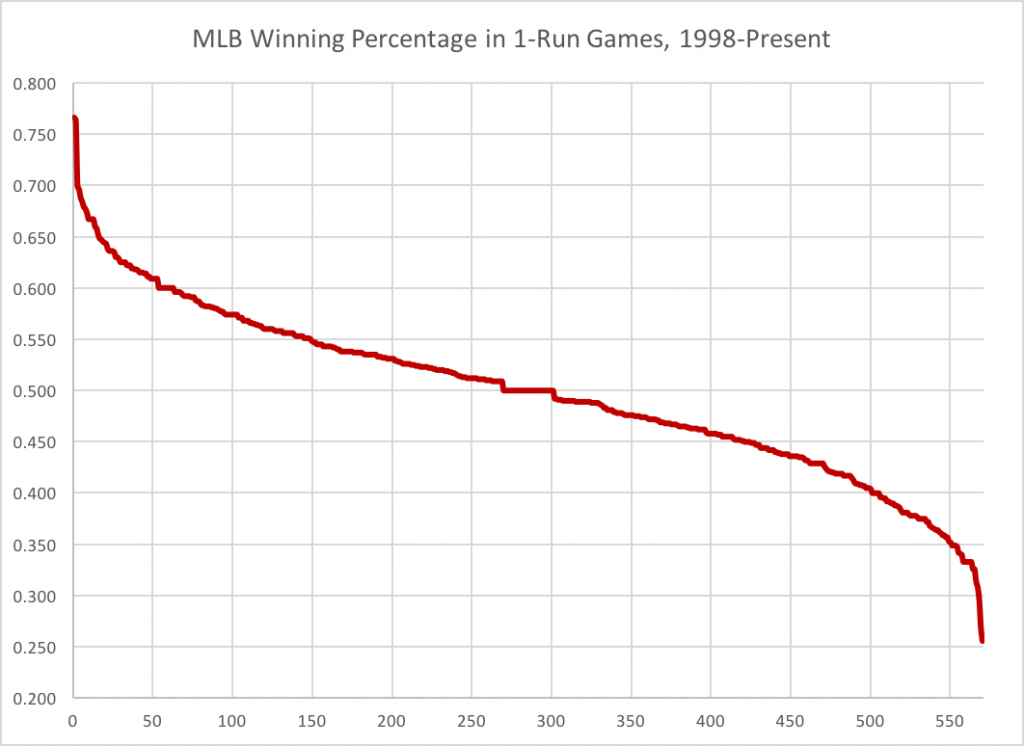
Surviving one-run games is important in baseball. Day-in and day-out, you can bet your bottom dollar that there are going to be some close games. That’s just how it goes. And for every game won by a single run, there’s one lost on the other side of the ledger. And that’s just how it goes, too. Your odds of winning a one-run game are just that, 50%, so long as we strip away all context. Perhaps a team can bend that a little by having a strong bullpen or a deep bench, but moving the needle in a major way is difficult. Of course, don’t tell the Texas Rangers that as they have the highest winning percentage in one-run games this season (.766) of any team since 1998, and it’s a good chunk of the reason why they’ve clinched the AL West. Tampa Bay is on the other end of the scale in 2016, having the worst winning percentage (.333) in one-run games this season. Overall, however, you can see that most teams don’t deviate much from the middle ground,
With 570 seasons played since 1998, it’s clear that most teams hover between a .550 and .450 winning percentage. Very few team exceed .600 or drop below .400. It’s a fairly steady curve and we should routinely expect any team to finish near the middle. But when the results are either extremely good or extremely poor, well, that’s mostly luck. And for the record, it should usually be considered extremely powerful luck as these outcomes can either push a team over the top or sink it completely. In those 570 seasons, teams have averaged 46 one-run games per season, which is something like 30% of all games played. With so many games being decided by a single run, doing exceptionally well in them or exceptionally poorly can make a big difference.
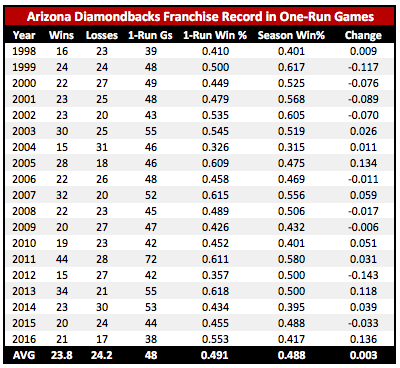
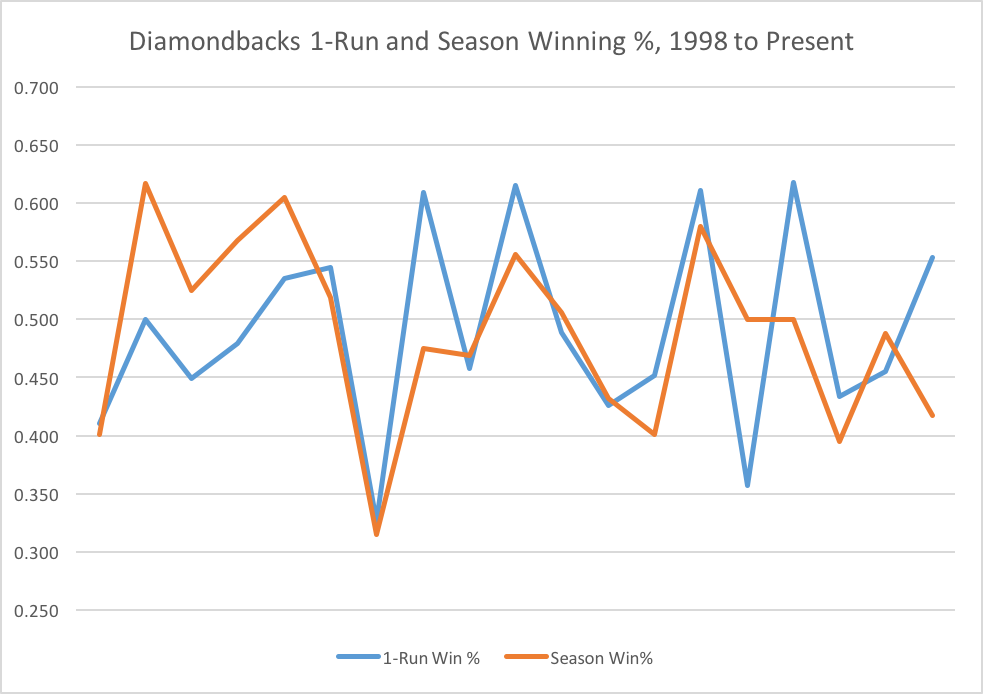
So you might think that the Diamondbacks in 2016, being as bad as they are (currently tied for the 4th-worst record in baseball) would be pretty poor in one-run games this season. Instead, it’s just the opposite. They’ve actually scored well in one-run games, coming out on top 21 times and behind just 17 times, good for a .553 winning percentage. But over time, betting on one-run performances tends to be a fool’s errand as there’s just very little predictive value here. Take a look at how the franchise has performed in one run games since their inception in 1998 (left) to present (right) as compared to their overall season winning percentage.
This season, the team has actually set a franchise record for over performing in a one-run context compared to their overall record, barely besting their mark in 2005 where they ended the year 28-18 in one-run contests and just 77-85 overall. Over their 24 seasons, things have broken mostly even, though, just as we’d expect.
 There are years in which they’re above average and years they’re below. Most of all, there’s little to no consistency here as one-run games just aren’t predictable. Understanding this is critical, because in a year in which the team’s record gets bloated by a lucky performance in one-run games, it’s easy to get carried away. But one must be cognizant that the effect is highly unlikely to carry over to the next season. It just doesn’t work that way, and the data bears that out.
I bring all of this up because I have a little pet theory. I can’t substantiate it with a direct quote, but the evidence seems to support the idea that in the last six years, the ones we remember most clearly, the team’s record in one-run games distorted reality. I believe this distortion led to some bad decision making, some of which is still effecting this club. Let me explain.
In 2011, the team played a staggering 72 one-run games. That’s 18 more one-run games than the next closest seasons (2003 and 2013). In those 72 contests, the team went 44-28 en route to winning the NL West by eight games over the Giants. But had the team gone .500 in those one-run games, things would have shaken out differently. They’d have been tied with the Giants for the division lead, but based on some luck, they prevailed. Winning 94 games and 86 game is very different. One scenario makes for a dominant team, the other makes for a competitive team that won a handful more than it lost.
The Diamondbacks misread their own record to some degree, and responded by adding nearly $20 million to the payroll in the offseason. They brought over Jason Kubel, Aaron Hill, Brad Ziegler, Trevor Cahill and others, figuring the team was on top and wanted to stay there. Instead, they flopped in one-run games to the tune of a 15-27 record and finished the year just .500. Had they split their one-run contests, they’d have finished the year with 88 wins, not nearly enough to catch the 94-win Giants. On paper, the team was still very competitive, but luck is a knife that cuts both ways.
They expanded payroll again in 2013, bringing aboard Martin Prado, Heath Bell, Cody Ross, Brandon McCarthy and Eric Chavez. They faired very well in one-run games, but the signings didn’t work out as the team struggled to a .500 overall record for the second year in a row. Without some luck in one-run games, they’d have been markedly worse.
Making one last go at it in 2014, the team added another large chunk of payroll in bringing aboard Mark Trumbo, Addison Reed, Bronson Arroyo and others. The team was miserable in one-run games and more miserable over the entire course of the season with players that just didn’t fit the ballpark and the National League as a whole. Payroll dropped in a big way in 2015 as the team has looked to re-tool to make use of Paul Goldschmidt‘s prime.
After the 2011 season, something changed. The team thought it was primed for contention for a long time and built aggressively, selling short and spending big. When that didn’t work, they doubled, then tripled down on the strategy. That led to far more disastrous signings than good ones with the team spending money often for naught. They also parted with some valuable pieces along the way as Adam Eaton would look pretty good in left field these days, Justin Upton had plenty of production left, Trevor Bauer has turned into a useful pitcher and even despite the injuries, Tyler Skaggs could still be considered an asset given his salary. Jason Kubel, Mark Trumbo, Bronson Arroyo and others were simply bad investments. All of this, of course, led to Kevin Towers’ firing and ushered in the new regime that might very soon become the old regime.
But 2011 was a turning point, one that saw the team shift into being an aggressive buyer without major financial resources. They bought often, spending their money on second and third-tier free agents with lackluster results to show for it. They traded for one-dimensional players that didn’t fit their ballpark or their league. The rest is history and Tony La Russa, Dave Stewart and De Jon Watson were tasked in some ways with cleaning it up. They’ve made their own blunders as the team has once again tried to push their chips in, this time via trades, but done so unsuccessfully. Perhaps understanding the fickle nature of one-run games would have altered their decision-making in the first place and put the organization on different track altogether.
3 Responses to One-Run Games Have Altered the Diamondbacks’ Franchise
Leave a Reply Cancel reply
Recent Posts
@ryanpmorrison
 Congrats to @OutfieldGrass24 on a beautiful life, wedding and wife. He deserves all of it (they both do). And I cou… https://t.co/JzJtQ7TgdJ, Jul 23
 Best part of Peralta’s 108 mph fliner over the fence, IMHO: that he got that much leverage despite scooping it out… https://t.co/ivBrl76adF, Apr 08
 RT @OutfieldGrass24: If you're bored of watching Patrick Corbin get dudes out, you can check out my latest for @TheAthleticAZ. https://t.co/k1DymgY7zO, Apr 04
 Of course, they may have overtaken the league lead for outs on the bases just now, also...
But in 2017, Arizona ha… https://t.co/38MBrr2D4b, Apr 04
 Prior to the games today, there had only been 5 steals of 3rd this season (and no CS) in the National League. The… https://t.co/gVVL84vPQ5, Apr 04
Powered by: Web Designers@outfieldgrass24
 Starting 2022 with a frigid dog walk sounds just lovely https://t.co/xoLZSZBpGp, Jan 01
 I’ll never forget seeing Kyle Seager at the Scottsdale Fashion Square one March with his family and thinking “damn,… https://t.co/uapNYdsU2a, Dec 30
 Big dogs. Bigger trees. @ Avenue of the Giants, Nor Cal https://t.co/YAdxcE1t1p, Dec 29
 Old friend alert https://t.co/7HQjiyBWTB, Dec 27
 Death wish https://t.co/XJzcMkNPTy, Dec 26
Powered by: Web Designers


I’d love to see the years labeled on the x-axis, but that’s not just the math teacher in me. Chart will suffice for credit I guess. (smile emoji)
I also can’t help but think about the tweet I sent you in regards to the then 30 one-run games the team has lost this year and how wrong that tweet must have been. What was I thinking? Well, related or not, you served up a nice article showing how these totals have played out. How much of a close game shows an advantage to great relievers is the next major question I’d be interested in exploring.
Thanks, now let us see this season end already.
Thanks for the reply, Jim. I’ll be honest on two fronts:
1. I couldn’t get excel to give me the X axis labels I wanted and was running close to a work meeting, so I had to skip that battle.
2. That tweet is what got me thinking about one-run games in the first place, so thanks for the inspiration!
They made the same error in evaluating the team in 2007 and went all in win now with the Byrnes Extension and the Haren Trade, instead of sticking with the program that Josh Byrnes had been on through 2006-2007.
Was , rinse, repeat