
The Diamondbacks’ bullpen blew twenty-nine saves last year. Twenty-nine. That’s too many (tied for first in MLB); you don’t need Bill James to tell you that. David Hernandez was a factor in the bullpen’s unreliability. After coming over from Baltimore in the Mark Reynolds trade, Hernandez was valuable in the bullpen in 2011 and 2012. He struck out batters at a high rate and posted a FIP under 3 both years.
The 2013 campaign was less friendly to Hernandez. He gave up 1.44 homers per nine innings, up from 0.53 in 2012. His HR/FB percentage was 12.8%, more than double his previous rates as a D-back. He also struck out fewer batters per nine in 2013, going from 12.91 to 9.53. When looking at the other numbers, nothing else seems drastically different. He walked a similar percentage of batters. He had eerily similar line drive, ground ball, and fly ball rates. Hernandez even threw his pitches with the same frequency. It’s hard to see why Hernandez was not able to repeat 2012’s success in 2013 – he did everything so similarly.
His bugaboo was the longball, but as a mentioned earlier, it wasn’t a byproduct of surrendering more fly balls. Brooks Baseball provides us with the nice visual:

(click to enlarge)
The fly balls per balls in play stay consistent for his fastball and slider – he throws one of those two around 95% of the time. The minute uptick in fly balls can’t explain the increased frequency in home runs allowed.
Hernandez’s splits are interesting; lefties slugged .514 against him while righties slugged .310. This gigantic split was new, but it seems like it’s just the product of some bad luck. I looked at fly balls per balls in play again, but this time sorted it by batter handedness:

Hernandez faced less left-handed batters than right-handed batters, and gave up less fly balls to them, yet somehow 80% of his home runs came against them? The issue seems to be that our sample size is too small. Only about eighty LHBs put balls in play against Hernandez over the course of the year. It just takes a few to go over the fence for the outcome to seem extreme. Hernandez faced bad luck against the long ball in 2013, particularly against lefties.
Home run percentage was part of the problem, but the lack of strikeouts was an issue too. Hernandez’s xFIP in 2013 was over a run higher than in 2012. One problem was that hitters swung at more pitches in the zone, and less pitches out of the zone.

It’s hard to say why this occurred. His release points were consistent, so it seems unlikely that he was tipping his pitches. The movement on his pitches did not change between years either. If Hernandez threw less first pitch strikes, then hitters would have the opportunity to be more selective. But that was not the case either.
It’s possible that hitters just figured out Hernandez and did a better job of laying off his strikeout pitches. Let’s look at his fastball in particular. Here are the swing rates and whiff rates for his fastball in 2011 and 2012, sorted by their location relative to home plate. (click to enlarge)
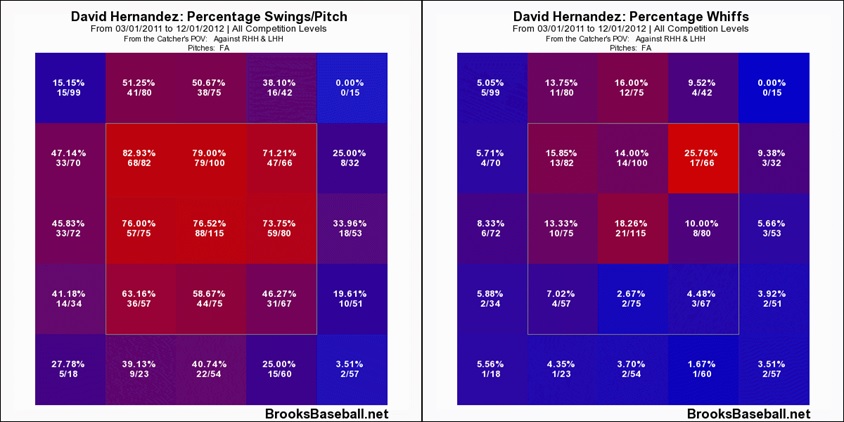
Notice how often batters were swinging at the high fastball, and how often they were missing. Now let’s look at the same statistics for 2013:
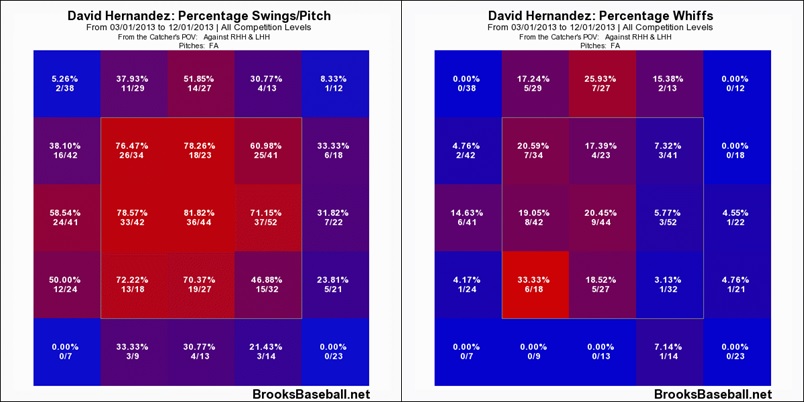
The whiff rates are still pretty high for the upper part of the strike zone and that space above the zone. It looks like the hitters finally decided to lay off more often on the high pitches, figuring out it was a fruitless effort. The places where hitters did a better job of not swinging are the places where Hernandez had high whiff rates. As a result, strikeouts went down.
Hernandez faced a combination of bad luck and smarter hitters last year. With new arms in the bullpen and youngsters with good stuff waiting in the wings, the D-backs might not give him a ton of time to figure it out.
If you enjoyed this article, please consider sharing it!


4 Responses to Hope for Hernandez?
Leave a Reply
@ryanpmorrison
 Best part of Peralta’s 108 mph fliner over the fence, IMHO: that he got that much leverage despite scooping it out… https://t.co/ivBrl76adF,
  RT @OutfieldGrass24: If you're bored of watching Patrick Corbin get dudes out, you can check out my latest for @TheAthleticAZ. https://t.co/k1DymgY7zO,
 - Of course, they may have overtaken the league lead for outs on the bases just now, also...
But in 2017, Arizona ha… https://t.co/38MBrr2D4b,
- Prior to the games today, there had only been 5 steals of 3rd this season (and no CS) in the National League. The… https://t.co/gVVL84vPQ5,
- RT @OutfieldGrass24: Patrick Corbin has a WPA of .318 and it's only the fifth inning.,
Powered by: Web Designers@outfieldgrass24
 RT @JonHeyman: In astros talks for Goldy, JB Bukauskas and Cionel Perez were in play. D-Backs took the surer bet and more diversif… https://t.co/t2CyKbOA4j,
 - Tarik Cohen is so fast he just tackled himself,
 RT @JCGonzalezOR: Special thanks to @HillsboroHops for hosting a LatinX community outreach and visioning session. This organization i… https://t.co/OxmEgwOpEh,
 - Old friend alert https://t.co/xwSHU0F8Hn,
- Every once in a while you get a beer that's just a little off... Usually happens to me at airports.,
Powered by: Web Designers

Good analysis. However, I would offer my own. The first two years Hernandez’s Fastball was outstanding. He has lost a few MPH on it. Instead of 95 – 98 mph it is 93 – 96. This is significant. This degradation means that more batters will turn around that fastball. He has compensated by throwing more sliders and I would say that is now is out pitch. The transition from a stand up there and blow them away with the fastball pitcher to a set up the slider with the fastball is in my opinion what lead to his horrible year. He could almost throw his fastball anywhere he wanted to the first two years. Now he can’t and that leads to behind in the count situations. And then finally you got to bring the slower fast ball over the plate. He is now in a situation where he needs to learn to pitch. Also, it would be nice if he had a good sinker or Splitter. This will make the fastball that much better.
One other thing.. if the slider is the out pitch, how comfortable is he throwing it to left handed batters. This could also be why Left handers were crushing his fastball.. they weren’t too worried about slider.
According the FanGraphs, Hernandez had a career-high average fastball speed of 94.8 MPH last year. To be clear, the average speed on his fastball went up in 2013.
Hernandez is an interesting case. He gave up 10 homers in 2013 and I didn’t see them all, but when I was watching, it seemed like he threw a blazing fastball in a fastball count and it didn’t have any movement and it got driven. That’s not scientific, I’m just talking about how it looked, without consulting Brooks Baseball pitch f/x. You can throw 98, great, but if they know it is coming and it doesn’t have any movement, big league hitters are going to treat it like batting practice. Do the stats bear this out? Hard to tell how this is going to play out going forward.