
Baseball is game of numbers. And with the increased use of advanced statistics, or sabermetrics, there are more numbers now than ever. We can literally look at the game from many angles, without even having to change our seat in the stadium. Advanced statistics allow us to find the true story, or at least something close to the truth, about a particular player or team. For instance, if we want to evaluate a pitcher, we are no longer prisoners to win-loss records or ERA. Instead, we can use some of the stats that you frequently see on this site, like FIP or xFIP.
Today, I want to introduce you to another pitching statistic, similar to FIP and xFIP, but a bit more telling. It is tRA, or true runs allowed. Designed by Graham MacAree at StatCorner, tRA is a defensive independent ERA estimator, like FIP or xFIP, but takes into account a very important component that the FIP-based statistics leave out, and that is, batted balls in play. For those of you well versed in our work here, you have been schooled to understand that balls in play affect a pitcher’s performance. Ground balls most likely turn to outs, or at least, less likely into extra base hits, whereas, fly balls, can turn into doubles or triples, and most fatal, home runs. It makes sense to consider the types of balls put in play against a pitcher when evaluating their ERA.
MacAree provides an excellent explanation of tRA over at Lookout Landing. Essentially, to save everyone from the complicated math, he explains how tRA is an improvement on ERA because it measures more of the things within the pitcher’s control. Sound familiar to FIP?
A pitcher with a poor defense should not be punished when comparing him to a pitcher with a great defense. It is the defense making the difference, not the actual pitching. The same goes for pitching in a cavernous ballpark versus a sandbox. So to take into account what a pitcher can control, we should look at things like strikeouts, walks, hit batters, home runs, and the types of balls put in play. A pitcher does have control, through the movement on the pitch and its location, on whether a batted ball is more likely to turn into a ground ball or a fly ball. Adding batted balls to the equation is where tRA is an improvement on FIP or xFIP.
Through a complicated formula, tRA figures out how many runs and outs each of the outcomes within the pitcher’s control are worth. And then we can evaluate a pitcher based on how many runs and outs a pitcher should have given up versus their actual performance.
So, now that you understand tRA, let’s look at the D-backs starters as an illustration to the advantage of using true runs allowed instead of FIP or xFIP. Note, for comparison purposes, we will use tERA, which is the same thing as tRA, but only includes earned runs, making it more comparable to ERA-based FIP and xFIP.
Here is a table of the D-backs starters this year in terms of their FIP performance.
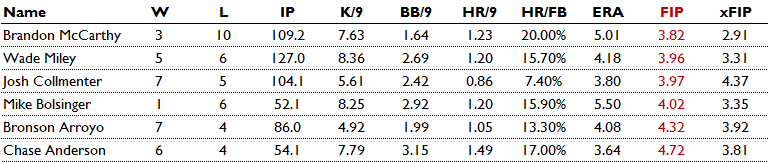
As you can see, recently traded, Brandon McCarthy, had a team-best FIP, and an even better xFIP, due to the correction in his HR/FB rates. FIP is rewarding the pitchers who strike out a lot of hitters, reduce their walks, and keep the ball in the ballpark.
Now, let’s look at the same group of pitchers, but in terms of tERA.
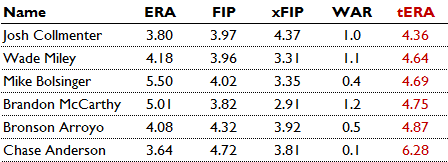
The story looks a little bit different now. Josh Collmenter rises to the top and Brandon McCarthy finds himself ranked fourth. Chase Anderson, who has the most favorable ERA at 3.64, ranks last both in terms of FIP and tERA. Keep that in mind when talking to friends.
What tERA is telling us that FIP misses is the impact that line drives, ground balls, and fly balls have on a pitcher’s performance. For example, Chase Anderson allows a line drive on 29.1% of balls in play, whereas, Josh Collmenter only allows a line drive 19.8% of the time. Hitters are more likely to turn balls in play off Anderson into hits – line drive rate has a high correlation with base hits. Collmenter also has a slightly better ground ball percentage than Anderson, and his increased fly ball rate is offset by a low HR/FB%.
Now, full disclosure. I just had you read this entire post, and now I am going to tell you that there is an improved version of tRA called SIERA. The principles are the same, but SIERA is a bit more accurate in predicting ERA by incorporating some improved calculations. Nevertheless, like in any math class, it is important that you learn each step along the process. You can’t do long division before you learn how to add and subtract. Understanding SIERA will be easier by understanding tRA.
For now, focus on the key points of tRA versus FIP. When evaluating a pitcher’s ERA, and deciding whether it is accurate or likely to remain at the same level, we want to look at the things directly within a pitcher’s control. FIP and xFIP start to do this, but by adding performance on balls in play, tRA (and SIERA) takes it a step further.
Statistics courtesy of FanGraphs.
If you enjoyed this article, please consider sharing it!


3 Responses to Evaluating the D-backs Starters Using Something Different
Leave a Reply
@ryanpmorrison
 Congrats to @OutfieldGrass24 on a beautiful life, wedding and wife. He deserves all of it (they both do). And I cou… https://t.co/JzJtQ7TgdJ,
 - Best part of Peralta’s 108 mph fliner over the fence, IMHO: that he got that much leverage despite scooping it out… https://t.co/ivBrl76adF,
 RT @OutfieldGrass24: If you're bored of watching Patrick Corbin get dudes out, you can check out my latest for @TheAthleticAZ. https://t.co/k1DymgY7zO,
 - Of course, they may have overtaken the league lead for outs on the bases just now, also...
But in 2017, Arizona ha… https://t.co/38MBrr2D4b,
- Prior to the games today, there had only been 5 steals of 3rd this season (and no CS) in the National League. The… https://t.co/gVVL84vPQ5,
Powered by: Web Designers@outfieldgrass24
- Old friend alert https://t.co/H8CeVQ90fG,
 RT @kbernot: Drank a lot of exceptional beers this year. Here are my top 10, for @CraftBeerBrew. https://t.co/cSgsipgZdD,
 - Piss off https://t.co/eb6nxEkWJt,
- Not a moment too soon for a whole host of reasons https://t.co/Y4t76VWAAp,
- Congratulations to K.L. and the Hops! There's an emphasis around the organization about being more than just a base… https://t.co/seFcjgViLU,
Powered by: Web Designers

It really doesn’t matter what statistic you use, whether it be old school or new school it just doesn’t matter. Our pitching flat out sucks any way you want to look at.
I’m just curious and I don’t know where I could find this, but could you tell me what league average tERA is please? Also, if you could league average FIP and xFIP. I’m interested to see how close they are to actual ERA with a sample size that large. As of right now, ESPN says major league average ERA is 3.81. Thanks.
Here are the league averages for each statistic in 2014:
There is a constant included in the FIP and xFIP calculations to bring it in line with league average ERA.
ERA: 3.80
FIP: 3.80
xFIP: 3.80
tERA: 4.14
Thanks. I knew FIP and xFIP where adjusted for the league, but I didn’t know it was exact.