
Regardless of what happens next, David Peralta is flat-out amazing. You know his story, a pitcher in the Cardinals organization felled by shoulder injuries only to rise again as a position player. After signing out of independent ball and playing his first game in the D-backs organization on July 3, 2013 — just before his 26th birthday — he erupted in the majors on June 1, 2014, to the tune of 2 hits in his first game and 12 hits in his first 28 PA. All he’s done is hit the ball hard, consistently, and run hard, consistently; despite playing less than full time in each of his first two seasons, he’s 107th in baseball over the last two years in doubles (38) and tied for third in baseball in triples (19). Among hitters with at least 800 PA between the 2014 and 2015 seasons, only 9 have managed a .300 or better batting average and a rate of extra base hits of 10% of AB or better: Peralta, Paul Goldschmidt, A.J. Pollock, Bryce Harper, Miguel Cabrera, Jose Abreu, Andrew McCutchen, Michael Brantley, and Troy Tulowitzki. Just like Zack Godley‘s success spawned a search for ground ball minor league pitchers, Peralta’s rise was so great that the D-backs started going hard after indy ball players.
Against right-handed pitchers, Peralta is a key cog in the D-backs’ run-making machine. Over the last two seasons, Peralta ranks 19th in baseball in wRC+ against RHP (143) among 241 hitters with at least 500 plate appearances against righties; that’s short of Goldy’s 152 wRC+ against RHP, but no more than A.J. Pollock (130 wRC+ against RHP) is short of Peralta. That kind of production is very, very difficult to replace; among the top 30 in baseball in wRC+ against righties over that same span, only two players have changed teams since the beginning of the 2014 season: Adam Lind, and Nelson Cruz. That top 30 list is like a who’s who of franchise cornerstones and megacontracts. A year ago, the D-backs were on a well-publicized search for another left-handed hitter; and at that time, Peralta looked like the answer to that question. He still does.
The main reason why Peralta wasn’t necessarily thought of as a solution a year ago: his success against lefties had come nowhere near that of his righty-killing prowess. In very sparing playing time against lefties in 2014 (81 PA), Peralta sputtered to a 38 wRC+. That’s… not very good. And considering Peralta’s age, and his particularly limited opportunities against lefties, I thought a year ago that we were looking at a player like Carl Crawford or Gerardo Parra, two other lefties who were fairly late to baseball and to being a position player, respectively; success against lefties could be very, very slow to come.
We’re pretty careful at this site about expressing our confidence level in things, and I can count on my fingers the number of things I’ve felt certain about to the point of writing with certainty. Before the 2015 season started, when it looked like the D-backs were gearing up for a 2016-2017 run (but before the all-in approach was revealed), I thought there just wasn’t enough time for Peralta to get better against lefties. He was so bad, I thought, that he could improve and yet still fall short of being useful against LHP. I gave up on Peralta against LHP. And I’m writing this piece because among the D-backs topics about which I was definitive in 2015, that’s the single biggest thing I got wrong.
The D-backs opened the season with a 4-man, 3-position outfield, which Chip Hale played to perfection. By the time Yasmany Tomas fit in, Mark Trumbo was traded. And about two weeks after Trumbo was traded to Seattle, Ender Inciarte went down with a hamstring injury that cost him about a month. In that period — from mid-June to mid-July — Peralta was pressed into near-full-time service, with plenty of starts against lefties. Then, we started to see something new out of Peralta — he started to handle those plate appearances against lefties.
In the end, Peralta had barely more PA against lefties in 2015 (90) than he did in 2014 (81). He had a 83 wRC+ against lefties in 2015, still solidly below league average, but much better than that 38 wRC+ in 2014. I was wrong to throw in the towel on Peralta hitting lefties; he did improve, and he improved enough that he was useful against LHP.
Whether he actually will be useful against LHP going forward is a different question — one to which I don’t think we know the answer. Small samples are all we have in looking at this. But Peralta is the poster child for using hard-hit data to look at whether a burst in BABIP is totally luck or founded more on skill.
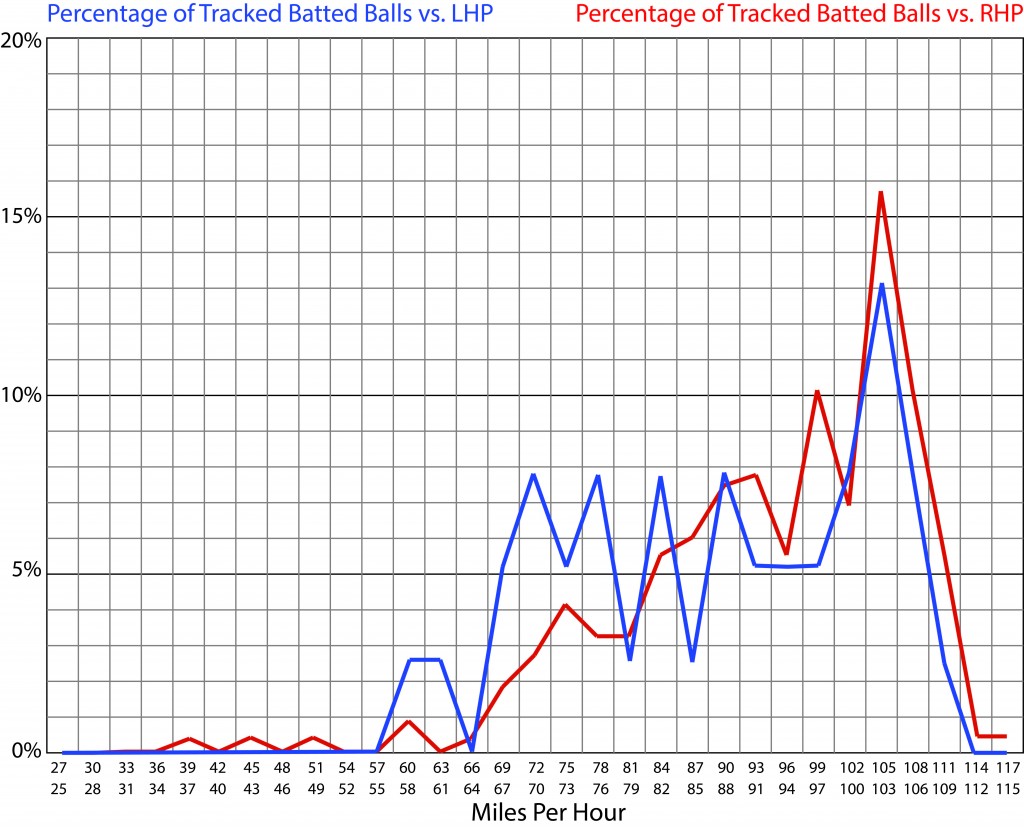
This line graph is a breakdown of Peralta’s batted balls by exit velocity, in buckets of 3 miles per hour. Our other research has strongly suggested that a player’s batting average is much more about how often he hits the ball particularly hard, rather than the player’s average exit velocity. Peralta is a big time winner looking at it this way; among the balls tracked and available at BaseballSavant.com, 37.4% of the balls Peralta hit in play were 100+ mph. That’s crazy; the percentage for the rest of baseball is just 22.4%, and since balls hit 100+ mph are hits something like 70% of the time (and those that are not are hits about 35% of the time), being above average on this metric has enormous consequences, even if the difference seems small.
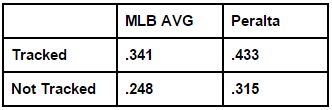 We’re talking just 38 tracked balls in blue above; Peralta hit the ball in play against lefties just 59 times in 2015, and there is data missing. As Tony Blengino of FanGraphs has observed, the data that’s missing includes outs more than the tracked data. In mid-August, Blengino had batted average on not-tracked balls at .248, and tracked balls at .341. Peralta’s results kept true to that rule — his tracked balls were hits quite a bit more often than his not-tracked balls, although even those went for hits at a good clip.
BABIP was first used as a way to guess at luck; we started using it to see how fielders and luck change the game. As a result, it doesn’t include home runs, since luck and fielders have little to do with those. With batted ball velocity, though, we want home runs back in. Let’s add them back in, and call the result “Batted Ball Average.” In 2015, the MLB “Batted Ball Average” was .329; Peralta’s was .406. Peralta’s .406 “Batted Ball Average” matches the combined total of his tracked ball average (of which there were 254, at .433) and not-tracked ball average (of which there were 108, at .315).
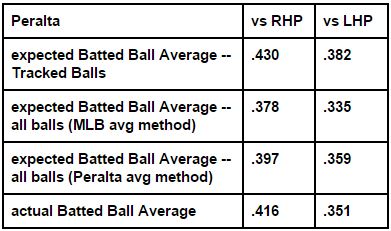
This background helps us figure out the extent to which Peralta may have been lucky when facing lefties. Based on research about expected average for batted balls in those same buckets of three mph, I would have expected a Batted Ball Average of .430 for Peralta against right-handed pitchers — and the blue line above converts to an expected Batted Ball Average of .382. But the not-tracked balls also tell us something, it seems, and when facing lefties, Peralta’s balls were tracked quite a bit less often. The blue line above is missing 35.6% of Peralta’s batted balls against lefties, whereas the red line above is missing just 28.7% of his batted balls against righties. In building the rest of our “expected Batted Ball Average,” we could fill in those blanks with the MLB average of .248 reported by Blengino, or we could use Peralta’s .315, as a kind of control in studying his platoon splits.
 In the first table above, it’s clear that Peralta was outperforming the rest of the sport in terms of batting average after contact — his batting average on tracked balls was 92 points higher (27% higher), and on balls not tracked, it was still 67 points higher (also 27% higher). Through luck, better field advantages, defenses favorable to him, or skill, Peralta got hits about 27% more often than the average hitter once the ball was in play (or over the fence).
But that advantage was one-sided. Controlling for how batted balls were grouped to the extent we really can, Peralta’s advantage over MLB fell to 10% against RHP and 5% against LHP. Small sample sizes plague this analysis, obviously, but at the moment, we’re trying to look at what actually happened, not necessarily Peralta’s skill level. And along those lines, the numbers suggest:
1. Peralta’s very high Batted Ball Average can’t be attributed completely to how his batted balls were grouped in terms of exit velocity.
2. If Peralta benefited from luck, he benefited from luck more against RHP than he did against LHP.
3. Peralta’s high .351 Batted Ball Average against lefties is supported by the batted ball data; the best “fill in the blank” number for us would probably be somewhere between the .248 average for not-tracked balls and Peralta’s .314 average for not-tracked balls, and as against lefties, Peralta’s .351 Batted Ball Average fits right in between the expected BBA from using the MLB average and from using Peralta’s.
Trying to figure out how well Peralta should have done in 2015 against lefties is not as simple as batted ball data, but it does capture a lot — all that’s really missing are walks and strikeouts. Peralta’s K rate against lefties was pretty high (25.6%), even as compared to his K rate against right-handed pitchers (19.7%). And while it’s really only a difference of about two walks, his walk rate against LHP (6.7%) was also lower than as against RHP (8.9%).
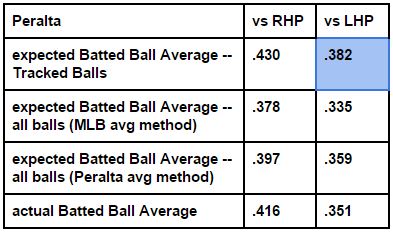 Take another look at the last table, especially the one that I’ve now shaded in blue. Based on how Peralta’s batted balls against lefties were grouped in terms of exit velocity (the blue line in the line graph above), Peralta should have outperformed the MLB average for tracked balls; .382 is higher than .341. As it turns out, Peralta did outperform the MLB Batted Ball Average against lefties; .351 is higher than .329. As for whether Peralta has improved against lefties… I wish we had exit velocity data for 2014, as we could see whether he was hitting the ball especially hard against lefties in 2014, or if that’s something he gained in 2015 (it’s something we would have picked up with our eyes). We do still have his actual Batted Ball Average against lefties in 2014, though, and .272 is nothing to write home about (compare with .329 for “average,” and the .351 number for 2015).
At this point, I feel like we can safely conclude that Peralta hits the ball very hard more often than the average MLB hitter, as a matter of skill rather than of luck. So far, we’ve gone into Peralta’s tiny sample of PA against lefties in 2015, and put it through an exercise to help derive more meaning from it than a sample that small could ordinarily have, using batted ball velocity. What we’ve found is that the number holds up; Peralta seems to have earned those extra hits against lefties. Peralta has a hard hit skill, and it looks like he did not lose that skill when facing lefties.
That should make us optimistic, I think. Whether Peralta becomes an above-average hitter against lefties will probably depend largely on his strikeout rate, which was just above 25% against lefties in both of his seasons. But I trust Peralta’s hard hit skill to make a difference, in general. With some evidence that it stays intact to some extent against lefties, maybe we can say at least that Peralta won’t be going into those left-on-left matchups next season unarmed.
If you enjoyed this article, please consider sharing it!


One Response to Will David Peralta Keep Hitting Lefties?
Leave a Reply
@ryanpmorrison
 Congrats to @OutfieldGrass24 on a beautiful life, wedding and wife. He deserves all of it (they both do). And I cou… https://t.co/JzJtQ7TgdJ,
 - Best part of Peralta’s 108 mph fliner over the fence, IMHO: that he got that much leverage despite scooping it out… https://t.co/ivBrl76adF,
 RT @OutfieldGrass24: If you're bored of watching Patrick Corbin get dudes out, you can check out my latest for @TheAthleticAZ. https://t.co/k1DymgY7zO,
 - Of course, they may have overtaken the league lead for outs on the bases just now, also...
But in 2017, Arizona ha… https://t.co/38MBrr2D4b,
- Prior to the games today, there had only been 5 steals of 3rd this season (and no CS) in the National League. The… https://t.co/gVVL84vPQ5,
Powered by: Web Designers@outfieldgrass24
- Imagine if there were no Bob tweets,
- Former #Dbacks first-rounder went to school, scuffled as a freshman, raked in his shortened sophomore campaign. He'… https://t.co/acUtcJcrKr,
- This should age well... https://t.co/6sUKOxSGuY,
 RT @jchaltiwanger: There has not been a single fatal incident linked to antifa in the US. Meanwhile, data from recent years has repeat… https://t.co/G9WfVzytXR,
  RT @ryanjhaas: Hi @CNN and @priscialva, this story actually wasn't first reported by the Washington Post. It was first reported by… https://t.co/h5NCPrx47g,
Powered by: Web Designers

[…] post. If you’ve seen the headline, you know all you need to know. It was fun, though, to use batted ball velocity data to pick apart David Peralta‘s better success against lefties in 2015, and I think enough of that to rely on […]