
One of my favorite debates within the baseball analytics community is how to evaluate pitching. We’ve collectively moved on from ERA since it has some obvious problems. The first is the most glaring: ERA tells most of the story of what happened, not how talented a pitcher is. We don’t really care what happened, we care mostly about how good a pitcher is going to be. Unearned runs don’t help the matter, and that helped push us towards RA/9 (runs allowed per nine innings pitched), and it has more predictive value than ERA, but not by a huge margin. FIP is built upon the DIPS theory but has some detractors, notably batted ball information. It’s easy to calculate with limited inputs but we’ve come to understand that batted balls are more controllable than first thought. xFIP normalizes home runs, then performs as FIP does, but some pitchers have historic home run issues, rendering xFIP’s value debatable. SIERA bakes in some batted ball information, along with the other inputs, making it a favorite in terms of identifying talent, but has been surpassed by yet another metric: DRA, or Deserved Run Average.
The New Face of Pitching Analysis
While the last paragraph might sound like a terrible bowl of alphabet soup and has the penchant for turning baseball fans off, it shouldn’t. We’re all after the same thing here, an attempt to answer the question, how good is a pitcher? That question should have value for any baseball fan no matter their desire to wade through the history of how we got here. Baseball Prospectus has been at the front here, using mixed models of statistical computation to come up with simply the best way to answer the question above. While the guts of DRA are complicated, the outputs are easy to understand. And, if you don’t feel like reading the backstory of DRA, that’s okay. Some of the sharpest minds in the game are behind it’s creation and you can instead just rely on the results to give you the best indicator of talent we have available. Year-to-year, DRA outperforms every other pitching metric at our disposal and it’s really where we should be focussing our efforts when evaluating pitchers.
Unpacking What’s Inside DRA
This is accomplished through the most thorough breakdown of pitching any metric achieves. While FIP is nice in that it limits inputs to just strikeouts, walks and home runs, we know there’s more happening than just those three things. FIP is a big upgrade over ERA, but by adding inputs, DRA has surpassed FIP by a comfortable margin. Those inputs are as follows:
- NIP Runs: not in play runs derived from things like walks, strikeouts and hit batsmen
- HIT Runs: runs saved on balls put into play
- OUT Runs: the pitcher’s ability to generate outs on batted balls
Here DRA covers the gamut of events while a pitcher is on the mound, resulting in the most comprehensive analysis of pitchers on the public horizon. The metric also normalizes for things like park factors, batter/pitcher handedness for every matchup, the catcher behind the plate, the umpire calling balls and strikes, and more. They’ve stripped out as much randomness as possible while including the largest range of inputs, creating the most holistic snapshot of pitchers. Pretty cool, right? In our attempt to understand how good a pitcher is, shouldn’t we consider everything? The answer is “yes,” we were just without the ability to do it well before DRA.
DRA and the Diamondbacks
Now that it’s here, we can apply it to our scuffling Diamondbacks pitchers and see just how they’ve performed to date (RA/9) versus how talented they are (DRA). The breakdown:
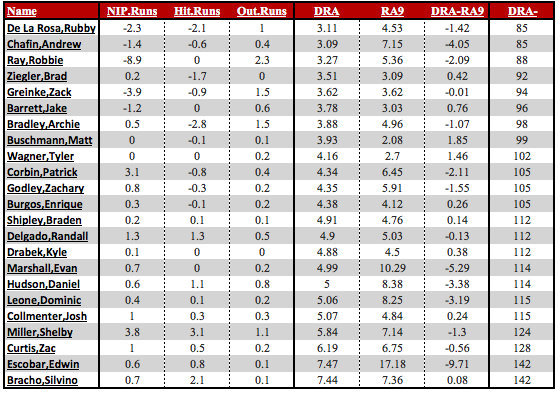
Let’s understand what we’re looking at here. The first statistical box contains the different components of DRA (NIP, HIT, and OUT Runs). Here you can see who’s been best in the strikeout/walk/hitter batter area (NIP Runs), best when it comes to controlling types of hits (HIT Runs), and generating outs on balls in play (OUT Runs). Run totals are calculated +/- from average, so a negative total shows strong ability to save runs. A positive totals shows extra runs allowed.
The second statistical box shows DRA (talent) and RA/9 (what’s transpired in 2016 to date), then subtracts DRA from RA/9. With DRA-RA/9, negative values show us pitchers who have better talent than what the results have bared. If you’re looking for pitchers that are better than what we’ve seen this season, look for the largest negative numbers. That might suggest some bad luck, likely on behalf of small samples in extreme cases.
The third statistical box shows DRA-, or how well a pitcher’s DRA relates to league average. Here, the smaller the number the better. Robbie Ray‘s mark of 88 means he’s been 12% better than league average when it comes to DRA. Silvino Bracho‘s 142 mark tells us he’s been 42% worse than league average. You get the idea — the better the pitcher, the smaller the number. Since we expect DRA to translate form season-to-season better than any other pitching metric, focusing here is valuable. If you wanted one singular piece of data to retain for future use, this is the metric to understand and bookmark when evaluating pitchers.
How Do Arizona Pitchers Measure Up?
Now that we have the information in our hands, let’s run through some pitchers, starting with the standouts. It would appear that what we saw Rubby De La Rosa wasn’t a mirage, at least in terms of performance. He really did turn a corner this year before being sidelined with an elbow injury he’s currently recovering from. Andrew Chafin‘s horrific RA/9 mark isn’t indicative of his talent, and we know that. Robbie Ray is currently third in the majors in K/9 and it shows. Despite his high RA/9 and ERA, he’s been the best starting pitcher for Arizona. No wonder teams were asking for him at the deadline. The departed Brad Ziegler was good, and you knew that. Zack Greinke has been solid, especially post-April, and Archie Bradley has been an average pitcher, but has pitched better lately.
Patrick Corbin and Zack Godley haven’t been as bad as one might think. The fact that they’re tied in DRA- in the first place is a little concerning for Corbin, who’s had his share of struggles. But he also hasn’t been that bad, either. Two starts into his big league career, Braden Shipley has been below average, but that’s too small of a snapshot to read into heavily as his debut wasn’t exactly sparkling. Tyler Wagner‘s sparkling ERA from early in the season was misleading to some degree, but again, small sample size warnings are in effect.
There are too many bad pitchers to list, and that’s not a revelation. Feel free to dig through that on your own. It’s depressing and I don’t want to talk about it.
Buy or Sell?
Since the team seems content to roll a similar core of position players out on Opening Day next season, the focus will be, once again, on the pitching staff. Zack Greinke will be in the fold for obvious reasons and so will Robbie Ray. A healthy and effective Rubby De La Rosa could finally change my mind about him being a reliever, but we’ll need see some positive signs before the end of September from him. Archie Bradley looks like a fine back end option, and that’s probably what Braden Shipley is in the short-term, if not long-term. Patrick Corbin has gone backwards this year as command has been troublesome for him. Zack Godley is a perfect fall-back/up-down/swingman option and Tyler Wagner can be the same. Shelby Miller is still a head-scratcher, although DRA likes his performance more than RA/9 and ERA, and we should trust that.
In the bullpen, it’s another story. Andrew Chafin and Jake Barrett are the best bets. Enrique Burgos is an all-or-nothing strikeout artist who’s best suited for righty-righty matchups in the middle innings. After that, we’re left with a confusing Daniel Hudson and little else. This team is going to need bullpen reinforcements this winter and that should be clear. Providing a platform their young relievers is perfectly acceptable for the remainder of the season, but it’s nearly impossible to see a functional bullpen from the arms they have in the mix right now. Jimmie Sherfy and Daniel Gibson could prove intriguing options, but won’t fix the firestorm that has been the D-backs’ bullpen.
Variations and Questions
What DRA can’t do is predict who will simply implode or emerge from nowhere. It can’t predict injuries, mechanical changes, new pitches learned, a rise/fall in velocity, or changes in how a repertoire is used. This is the best way to evaluate a pitcher based on what’s taken place and gives us the most confidence in predicting what will occur in the future. But there can still be wild changes. It’s just that the changes found through DRA are less extreme than the other pitching metrics.
It also paints a murky picture of what those expectations should be. Even as DRA regresses Corbin’s performance somewhat, can he regain his above average stature? Does Shelby Miller go home this winter and come back with his mechanics ironed out? Does Rubby De La Rosa pick up where he left off or have we already seen the best from him? Are any of the young relievers going to take a step forward? DRA can’t help us much here as the onus falls on the coaching staff and player development personnel running the show. While DRA gives us the best snapshot and predictions going forward, there are still plenty of questions surrounding where this team goes from here in regards to its pitching staff.
If you enjoyed this article, please consider sharing it!


20 Responses to D-backs Pitching Through the DRA Lens: Our Cleanest Look at Talent
Leave a Reply
@ryanpmorrison
 Congrats to @OutfieldGrass24 on a beautiful life, wedding and wife. He deserves all of it (they both do). And I cou… https://t.co/JzJtQ7TgdJ,
 - Best part of Peralta’s 108 mph fliner over the fence, IMHO: that he got that much leverage despite scooping it out… https://t.co/ivBrl76adF,
 RT @OutfieldGrass24: If you're bored of watching Patrick Corbin get dudes out, you can check out my latest for @TheAthleticAZ. https://t.co/k1DymgY7zO,
 - Of course, they may have overtaken the league lead for outs on the bases just now, also...
But in 2017, Arizona ha… https://t.co/38MBrr2D4b,
- Prior to the games today, there had only been 5 steals of 3rd this season (and no CS) in the National League. The… https://t.co/gVVL84vPQ5,
Powered by: Web Designers@outfieldgrass24
 RT @cdgoldstein: https://t.co/dJRjCFuXK0,
  RT @ZHBuchanan: If you haven't filled out our Diamondbacks fan survey yet, there's still time. We want to hear from you!
https://t.co/ctzkNTbk5s,
RT @ZHBuchanan: If you haven't filled out our Diamondbacks fan survey yet, there's still time. We want to hear from you!
https://t.co/ctzkNTbk5s, - “Top US News: Tesla merch now available for purchase with Dogecoin”
The point at which I wish to formally withdraw… https://t.co/7k38A7nDCQ,
- Ya boi with the feature image https://t.co/g3SMJYmAQq,
- Nelson fell asleep waiting for Simcoe to get home from the groomer. I’m jealous, honestly. https://t.co/CO4FZtwhUJ,
Powered by: Web Designers

It’s depressing and I don’t want to talk about it. – DBacks 2016 Season Motto
Should we worry *at all* that shoving all of these young pitchers onto the mound everyday, only for them to be absolutely hammered, could damage them more than it develops them? I haven’t seen anyone bring this up, but I’d have to think that at some point, the negatives outweigh the positives if a guy’s performance is just terrible over and over again….
More importantly, thank you for this intro to DRA. I think I’ll reserve a little skepticism. I remember, as perhaps you younguns don’t, how DIPS was the final answer in pitching and anyone who suggested that pitchers (or batters!) could significantly control the outcome of batted balls (beyond their going over the fence, always a weird caveat) was an idiot. Thank God in the last couple of years we’ve finally gotten beyond that.
You are totally correct, DIPS paved the way and taught us a lot about how to evaluate pitchers. That was a major breakthrough. DRA takes it several steps further, however. Is it the be-all, end-all of pitching analysis? Probably not. A contact of mine who’s worked with teams shared that a lot mixed modeling (which DRA represents) is being used with the top analytical teams. DRA gets us closer to the truth when it comes to evaluating talent.
One downside to DRA is that it’s incredibly complicated. FIP could be calculated at home if you knew the linear weights associated with strikeouts, walks and home runs (which were published online). DRA would be nearly impossible to crack on your own. I see that as a turnoff for some since you basically have to trust it as constructed (and believe me, it’s constructed very well by folks who’ve consulted for major league teams) without being able to really analyze it.
Still, it’s the best we have in my mind, and the yearly correlations back that up.
One more comment. I assume the follow-up piece will be along the lines of: why does every Dbacks starter, save Greinke, have a significantly negative DRA-RA9? Does it have something to do with the catching? The defense? Significantly worse performance with runners on base? Terrible strand rates? What’s going on here?
DRA is taking several things into account that are RA/9 isn’t.
DRA adjusts for park factors, RA/9 doesn’t.
DRA adjusts for catcher and umpire behind the plate. RA/9 doesn’t.
DRA adjusts for defense, RA/9 doesn’t.
DRA calculates the “individual pieces” of pitching, not runs allowed, which gives us a predictor of runs allowed. RA/9 is just a calculation of runs allowed with no other factors considered.
So in one, we have a predictor of performance, the other takes no context into mind (like the horrible strand rates you mentioned) and the other is a simple calculation. I’d rather look at talent than just outcomes, because outcomes vary far more wildly than talent does.
Oh right. I think I was misunderstood here. Wasn’t questioning DRA. Rather, I thought that the differences between DRA and RA9 could be illuminating, if we knew what was driving them. For instance, if we didn’t adjust DRA for the catcher behind the plate, how much does that gap b/w DRA and RA9 close for Dbacks pitchers? What if we did the same for non-catcher defense? Etc.
In short, if I were GM, I’d want to know this: if we improved our defense next year to league average, how much would our pitching outcomes improve? Same question for catcher defense, same for strand rates, etc.
Hey Lamar, thanks for clarifying. So to my understanding, DRA is “normalized” for all of those factors. So, if you’ve got a poor framer behind the plate, it’s not going to punish the pitcher because framing pitches is the catcher’s job, not the pitcher’s (mostly). Same for defense and the like. Therefore, DRA is what you should expect from a pitcher if you had average performance behind the plate, a normal umpire, normal defense, a normal park, etc. A pitcher’s DRA should be very close to his performance with normal sequencing and average external factors. You can’t change the park, but you can change your catcher, your defense, etc. The sequencing of events is pretty random, so there will always be some noise here, but you’d expect pitchers’ ERAs to be close to their DRAs if you had average framing, defense, umpires, etc. There’s going to be inflation for luck and park factors, but it should be close.
[…] D-backs Pitching Through the DRA Lens: Our Cleanest Look at Talent […]
“Year-to-year, DRA outperforms every other pitching metric at our disposal”
Jeff, is there any peer review corroboration of this statement ? (meaning corroboration NOT from Baseball Prospectus ?)
Great question! BP is the only one publishing this fact because they’re the owners of DRA. FanGraphs won’t say, “hey, DRA is better than FIP,” because all of their models are based off of FIP. But a simple correlation over a three year span shows that DRA is most accurate year-to-year. That’s a statistical correlation, which is pretty hard to disprove.
In the analytics community, FGs has taken some heat for sticking with FIP now that BP has a couple of metrics that are more inclusive. Some over there remain ardent about FIP because it’s easier to calculate. They have to weight whether or not they’re interested in the “approachable” version or the “most accurate” version. So far, they’re going with the former, but I wouldn’t be shocked to see them alter that at some point.
also, in the case of the D Backs, I suggest you compare DRA to xFIP, and in the case of the starting pitchers where you have larger sample sizses you will find with the exception of Rubby and Miller, everyone else is with 0.13 between xFIP and DRA. Rubby has 0.56 lower DRA than xFIP, and Miller has 0.71 higher DRA than x fip.
I’m not seeing a lot of difference between DRA and xFIP.
Name xFIP DRA Diff
Zack Greinke 3.75 3.62 0.13
Robbie Ray 3.35 3.27 0.08
Archie Bradley 4.38 3.88 0.5
Rubby de la Ros 3.67 3.11 0.56
Zack Godley 4.22 4.35 -0.13
Patrick Corbin 4.35 4.34 0.01
Shelby Miller 5.13 5.84 -0.71
Take a look here for the specific correlations. I think xFIP has mostly been debunked because it normalizes home runs. But home run distribution isn’t normal. Some guys give up more over their careers, others less. We know this and should account for it. I see that you have pulled some pretty close numbers, but I’d be very curious to see how that holds up across baseball over a three or five year span. My guess is that this is somewhat luck.
oops, sorry, archie’s DRA also significantly lower than his xFIP
What is the team total DRA vs. Team xFIP ?
Here’s what we get for the D-backs:
DRA: 4.28
ERA: 5.07
FIP: 4.52
xFIP: 4.31
SIERA: 4.26
As I’ve said before, SIERA was the best of the bunch before DRA. But a one-year sample is a bad sample. We need more data. In fact, we’re only 2/3 of the way through 2016. Need more data for this to really stabilize.
You can find team DRA here:
http://www.baseballprospectus.com/sortable/index.php?cid=1932763
You can find player DRA here:
http://www.baseballprospectus.com/sortable/extras/dra_runs.php
Thanks for all the responses to questions Jeff. Great stuff.
Look forward to continuing to study and review. Was aware of DRA of course, but I don’t have BP subscription and in the past you can’t really sort or slice and dice the info unless you subscribe. Looks like what you linked is sortable, but the second player table doesn’t show IP , and I’d focus more on the pitchers with at least 80-100 IP
I did notice above of course that Siera, xFIP, and DRA saying pretty much the same thing, but it would be good to see a more exhaustive study over multiple years, players and teams as you point out. Of course as always, sample size is king.
I personally never use FIP and xFIP as be all end all. They are data points for me, as are the batted ball profiles, and everything else. DRA is trying to roll all up into one, and thats good, makes thing easier like you say.
BUT, it needs peer review, it needs extensive work to prove that it is more PREDICTIVE than the other metrics. For now, for me, it’s another valuable data point, but none of these supercede the other.
Finally, while of course batted ball types influence BABIP a great deal, it’s still important to remember that DIPS is still much more right than wrong.
In the last 30 years there have been 263 pitchers with over 1000 IP and 60% or more of them being starts.
Of those 263, there is ONE pitcher with a sub .250 BABIP, (Sid Fernandez), only 2 more that are below .260 (Charlie Hough and Chris Young) and only 4 more under .270, and then there are another 20 guys between .270-.280
And of course of those guys under .280 the majority are flyball pitchers, as obviously BABIP on fly balls is lowest.
The range is remarkably small.
There are about 20 guys over .310, and as mentioned 27 guys under .280.
The other 210 pitchers or so are all within .280-.310
I’m not saying the difference between .280-.310 isn’t important. Of course it is. BUT….when you see guys with a .250 BABIP over 3 years, it’s almost impossible for that to be his real skill level, and with a few exceptions, when a guy jumps up over .310 when he’s always been under .300, unless he’s hurt it’s most likely luck.
DIPS isn’t “wrong”, and Voros VERY QUICKLY in the process acknowledged that pitchers have some control over BABIP based on batted ball types. I know this for a fact because I have read his early writings and the debates, and because I know him personally and have discussed it at length.
So lets not throw out the baby with the bathwater. Everything that has come after DIPS is tweaking and improvements, but nothing has “disproved” DIPS theory, it’s only been enhanced.
sorry, forgot link
The link to your saved query/report is:
http://bbref.com/pi/shareit/K4ddT
[…] make the plod more endurable. At times, Robbie Ray has filled that void. As someone who probably deserves better outcomes than the ones he’s been given, those times ought to happen more frequently. However, there’s a discernible pattern to both his […]
[…] got some flaws, especially for pitchers. A while back I advocated for looking at things through the lens of DRA because it’s a superior metric to FIP, but we’ll just run with fWAR throughout here for […]
[…] can make some mental adjustments. Further, DRA is as context-neutral as possible, which I’ve broken down in more depth in the past, but we know that context matters. Chase Field remains a hitter’s park and the team had lousy […]
[…] improvements isn’t the safest bet. Talent, however, is and the team remains short on it, especially in the pitching department. There’s just almost no way to add that many wins to the roster without significant currency. […]