
Writing this website over the years, we’ve encountered some pushback from time to time. We fully expected that. Traditional statistics have been engrained in us. If you collected baseball cards, you quickly became familiar with games played, at-bats, batting average, slugging percentage, RBI’s and more. This was the foundation of understanding of which players were good and which players were not. Over time, questions arose and it was Bill James and others asking those questions. His drive for a deeper understanding propelled others to enhance our understanding of the game, especially when it came to player evaluation. Soon came the DIPS theory, our understanding of the times-through-the-order penalty, run expectancy and more. PITCHf/x led a new charge starting in 2008, and while teams have had FIELDf/x and HITf/x for years these products were never offered to the public. Teams were working with more data than the public, essentially.
Early in this decade, products like Trackman took technology from golf and applied it to baseball, tracking things like exit velocity and launch angle. This information wasn’t readily available to the public either, though it would at times trickle out in the form of hard hit percentage or something similar. From 2008 to 2014, there wasn’t much in the way of new information. Baseball Savant changed that as batted balls started being tracked more accurately and we could finally see just how hard balls were being hit. Our understanding of what we wanted to see out of hitters changed dramatically as we’ve seen how productive hard-hit balls, particularly those that are hit in the air, often are. The new understanding was robust but left questions, though it was clearly a large step forward. Pitch spin and catcher framing have become things we can better evaluate, with teams altering their priorities accordingly. But we were missing defense. If you’ve wanted to poke holes in WAR over the last decade, the defense component was the best place to do it. UZR and DRS are imperfect and that’s been widely known and accepted, though we had no replacement. For the public, we were making due with what we had.
A New(er) ERA
We seem on the cusp of another inflection point. Statcast has been slowly rolling out for the last two years and they’ve hired some very smart people to head up the work. Mike Petriello (ESPN, FanGraphs, others), Tom Tango (author of “The Book”) and Darren Willman (Baseball Savant) have led the charge and now Statcast appears ready to give us perhaps the most thorough understanding of the game that we’ve ever seen. As the folks behind Statcast have been working diligently to create new tools, answer old and new questions, and create digestible formats for the public, there are two new items that we’ll see this season: Hit Probability and Catch Probability. With more data to work with than ever before, these two new stats can help us get to the heart of identifying the strongest (and weakest) performers.
Hit Probability
Hit Probability, at it’s core, may sound familiar to some of the things you’ve read here before. Each batted ball has its launch angle (vertical), spray angle (horizontal) and exit velocity recorded. We know a couple of things inherently:
- Fly balls are good, but only to a certain extent — a 27-degree launch angle is better than a 47-degree launch angle as one’s often a homer and the other is a lazy fly ball
- Ground balls have to be hit either really hard or really softly to be useful — pounding a one-hopper up the middle or dribbling a squibber down the line can result in a hit, but an easy roller to second is almost always an out
- Line drives are almost always good — yeah, sometimes they get snagged, but in terms of consistency, line drives are very productive batted balls
- Hitting the ball hard is almost always good — the donut hole is a real thing as sometimes a ball that might have fallen in behind the shortstop and in front of the left fielder is hit exceptionally hard carries to the outfielder, though this is the exception and not the rule
The above are hardly new phenomena and we’ve touched on all of them before. You’ve seen these things with your own eyes while watching the game. So what does Hit Probability bring to the table? The new measure will assign the probability that any batted ball become a hit based on historical trends. If a hitter launches a ball 106mph to center and it travels 408 feet, that ball is a hit 95% of the time. Whether an outfielder makes a tremendous play and somehow snares it or it lands, bounces and becomes a double, the hitter gets the same credit. The ball was hit hard at a solid angle and almost always lands for a hit. That allows Statcast to project what usually happens, giving the batter the assigned credit no matter what happens in the field. This projection can help us determine who’s process is superseding or undermining their results. Think of this number as expected offense. While luck will always play into the game, this type of number can be very useful for us.
Perhaps even better, this doesn’t just apply to hitters. The same information can be applied to the type of contact a pitcher allows. For a long, long time, we’ve relied on ground ball rate and fly ball rate to describe the nuance of batted balls allowed by a pitcher. We’ll finally move past that now as not all grounders and fly balls are created equally. Rather than grouping them into two large buckets, the batted balls can be nuanced to tell us who’s allowing weak contact, hard contact, and everything in between. In a park like Arizona’s this may be incredibly useful. With a massive outfield and thin air, a more detailed understanding of who succeeds and who doesn’t — and why — will help us move our understanding forward in a big way.
By Opening Day, Baseball Savant will host this information for the last two seasons, allowing us to dig in retrospectively. Meanwhile, new running leaderboards will be updated daily for the 2017 season, so that’ll be something to watch as the season rolls around.
For more, visit: Hit Probability
Catch Probability
For outfielders, we’ve long been asking a basic question: how good was a great-looking catch? Take our hometown boys, A.J. Pollock and David Peralta. A ball in the right center gap might be an easy play for Pollock who makes the catch on the run. If Peralta were filling in for Pollock in center (luckily we won’t see that in the future), Peralta might make a diving grab to snare it. One ends up on SportsCenter, the other is a routine out. Pollock made the easy play, but Peralta made the great-looking play. How does that affect our perception of their performance?
Catch Probability will help us solve this issue. Statcast allows for a few key measurements:
- Determining where an outfielder started in the field before the ball was hit, and
- How far the outfielder had to run to get to the ball
- How long, based on hang time, the outfielder had to cover the ground needed to make the catch
With these items in mind, Statcast can project the likelihood of every batted ball the outfield being caught (or not caught). Perfectly-placed balls in the gap are almost never caught. Lazy flies to left field are almost always caught. If we know how often these batted balls are turned into outs, we can then evaluate how often a particular outfielder converts these balls into outs and compare against the average baseline. This should more precisely tell us how good (or bad) an outfielder is, how his range limits his ability (or enhances it), and we can formulate a more holistic opinion based upon historical trends. Like you, I am waiting to apply this directly to Yasmany Tomas.
To get an idea of what this looks like in graphical form, see Statcast’s chart below (keep in mind “distance” is the distance the fielder has to run, not the distance of the batted ball):
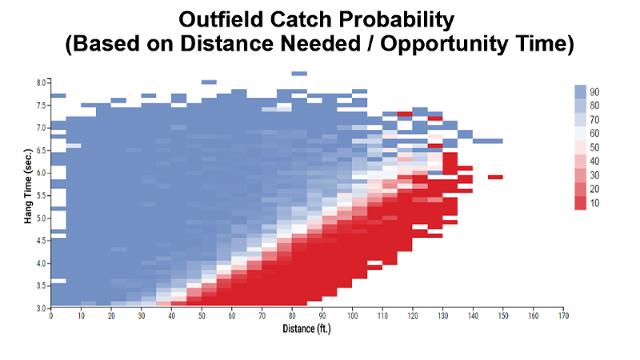
The bluer the area, the more likely the ball is to be caught for an out. The redder the area, the less likely the ball is to be caught for an out. The white area is the zone where plays are marginal. Here we’d expect good fielders to make the catch and the poorer fielders to allow them to fall in. This is where the attention will be focused. We’re less concerned with the obvious outs and the obvious hits because they are what they are. We’re more concerned with what lies in the margins.
For more, visit: Catch Probability
Brace Yourself
As these stats become part of the larger analytical lexicon, we’ll surely be looking for ways to incorporate them. Baseball Prospectus has made monumental strides in catcher framing, we’re learning more and more about batted balls, and PITCHf/x can tell us a ton about pitches, but we’re still missing an infield component. Statcast is working with this as well, but it’s a tougher nut to crack with shifts, baserunners and more complicating the situations in play. This will come in time. For now, prepare yourself for Hit Probability and Catch Probability as they’ll be part of our process and start creeping into the mainstream come Opening Day.
If you enjoyed this article, please consider sharing it!


2 Responses to Statcast and a New Era for Evaluation
Leave a Reply
@ryanpmorrison
 Best part of Peralta’s 108 mph fliner over the fence, IMHO: that he got that much leverage despite scooping it out… https://t.co/ivBrl76adF,
  RT @OutfieldGrass24: If you're bored of watching Patrick Corbin get dudes out, you can check out my latest for @TheAthleticAZ. https://t.co/k1DymgY7zO,
 - Of course, they may have overtaken the league lead for outs on the bases just now, also...
But in 2017, Arizona ha… https://t.co/38MBrr2D4b,
- Prior to the games today, there had only been 5 steals of 3rd this season (and no CS) in the National League. The… https://t.co/gVVL84vPQ5,
- RT @OutfieldGrass24: Patrick Corbin has a WPA of .318 and it's only the fifth inning.,
Powered by: Web Designers@outfieldgrass24
- Every once in a while you get a beer that's just a little off... Usually happens to me at airports.,
- If Pollock doesn’t sign with a team that wears red uniforms I’m going to be really disappointed. Working theory: Se… https://t.co/zHn9DqzEiD,
- The work here by @Britt_Ghiroli is splendid https://t.co/c8tSq0vw3T,
 RT @TheAthleticAZ: Plenty of #Dbacks fans gave it some time - and they still don't like the idea. The "why" from @ZHBuchanan
https://t.co/9oDlvue3fV,
RT @TheAthleticAZ: Plenty of #Dbacks fans gave it some time - and they still don't like the idea. The "why" from @ZHBuchanan
https://t.co/9oDlvue3fV,  RT @CardsNation247: Episode 30 of the Cardinals Nation 24/7 Podcast, Hosts @ToR_Ron75 & @JMRedwine welcome @buffa82 of @KSDKSports &… https://t.co/7dbIEzcahN,
Powered by: Web Designers

Enjoyed the read! Trying to learn this stuff.
Looks like we’re getting pretty far away from “grit” as our primary means of evaluation.