
By virtually any metric, it’s hard to look at Trevor Cahill‘s recent performance and conclude that he’s likely to be a good value at his $12M salary for 2015. But that doesn’t mean that he’s not worth more than the $520k the team would be likely to recoup by releasing him. As recently as 2013, Cahill was arguably an above-average starter — and although the results didn’t match, he was substantially the same pitcher in 2014.
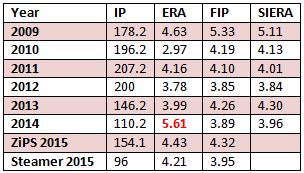
Cahill’s 5.61 ERA in 2014 came in 110.2 innings, meaning he bears a pretty big chunk of the blame for the team’s 4.26 ERA last year, which ranked the D-backs 5th-worst in baseball. If you back Cahill’s 7.7% of team innings out of the mix, the team staff would have had a 4.17 ERA, which would have left them ranked…5th-worst. The D-backs staff was, let’s say, not so good regardless of Cahill.
In fact, as we have repeatedly documented but not really explained, the vast majority of the pitching staff underperformed last year, both in terms of our 2014 expectations for each pitcher and in terms of how even the intermediary results that actually played out ended up turning into runs. SIERA ranked the D-backs staff 10th best. The only staff with a bigger negative difference between SIERA and ERA was the Rockies.
Cahill was not so great last year, and it wasn’t just about the very rocky start (7.09 ERA in April) — his 5.66 ERA in the first half was almost identical to the 5.58 mark he put up in the second (in substantially more innings). But the point is that, while he underperformed in a fairly significant way, the rest of the staff did, too. As compared to SIERA (3.59), the staff ERA (4.26) was marked up by about 20%. As compared to SIERA (3.96), Cahill’s ERA (5.61) was marked up by about 40%. The wheels came off for Cahill, no question. But be it pitch sequencing, defensive inefficiency, something different with Chase Field or a combination of those and other things, it seems like a big part of Cahill’s struggles had little to do with Cahill.
Let’s see if we can determine how much of Cahill’s 2014 struggles were due to luck, and what, if anything, we can point to that was different. But as a backdrop, let’s also keep in mind that in terms of the stats that go into Fielding Independent Pitching — walk and HBP rate, strikeout rate, home runs — Cahill actually wasn’t worse. At all.
Behind the Numbers (Are More Numbers)
Armed with these ERA, FIP and SIERA numbers, we can start to identify likely causes for Cahill’s 2014 problems. Given that his FIP actually went down, we can make a good guess that Cahill’s total walks, strikeouts and home runs weren’t the culprit. Since SIERA matches up with FIP, I would normally suspect that batted ball rates also aren’t to blame — although those changed so much in 2014 that I will keep them in the mix. And SIERA’s consistency with FIP helps lock down the idea that although Cahill’s walk and strikeout rates per 9 IP did climb in 2014, that had a lot to do with him facing more batters per inning. The jump from 3.99 BB/9 to 4.47 BB/9 would be meaningful but for the fact that the “9” part changed — on a batter-for-batter basis, Cahill’s BB% rose only from 10.2% to 11.0%.
Unless I’m missing something, the remaining explanations fall into three buckets:
1. Something Cahill was doing that led to his pitches getting hit harder more frequently (not luck).
2. Balls falling in for hits more frequently than we would expect them to (luck, or defense).
3. Inconsistency; SIERA and FIP have guessed wrong because they’ve assumed that Cahill’s bad stuff weren’t as lumped together as they were.
Line Drive Rate
Trevor Cahill saw his ground ball rate, typically very high for a starter, sink to 48.5%, below 50% for the first time since 2009. And most of the missing hits weren’t fly balls, although there was a bit of an increase there — it was Cahill’s LD% that changed the most (proportionally).
See, Cahill has generally had a good LD%. His 2013 LD% was 19.8%, the highest of his career to that date but still not bad; last year that rate would have tied him with Justin Verlander and Madison Bumgarner at 31st among 88 qualified pitchers. Even now, his career LD% is 18.2%, which would have ranked him 8th last year out of 88. In his first year with the D-backs, Cahill had a 16.1% LD% — and last year, that would have ranked him 1st out of 88, ahead of Alex Cobb‘s 16.4%.
Last year’s LD rate wasn’t just worse. It was really bad: 24.4%. Considering that line drives turn into hits about five times as often as fly or ground balls, that makes an enormous difference. And for what it’s worth, only one of those 88 qualified starters last year had a rate that was worse (Ervin Santana, 24.7%). Not good.
I checked in with ESPN Stats & Info to find out: is this just a matter of batters hitting Cahill’s pitches more level, or is this more a matter of Cahill’s pitches getting hit more hard? Turns out that while Cahill’s Hard Hit Average of .173 wasn’t awful (Josh Collmenter‘s was .191, Wade Miley ranked more or less in the middle with .156), it was still pretty bad. That .173 HHAV would have tied him at 77th with two other pitchers among those same 88.
The weird thing, though, is that while the .173 HHAV is not good, it was exactly the same in 2013. And it was higher (.207) in 2012, by a very significant margin. Cahill was not having the cover torn off of the ball in 2014 — not any more than in the past. The change in LD rate was more a matter of launch angle (although, let’s be clear, we’re only talking about a difference of about 12 balls hit into the field). Putting aside (for today) the question of why Cahill was giving up fewer ground balls, we can at least say: Cahill’s downswing was unlikely to be the product of players teeing him up.
Luck or Defense
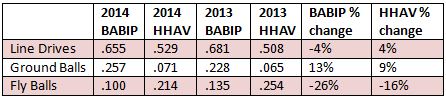
The 84 line drives that Cahill gave up last year turned into hits (when they were in play; two were bombs) at a .732 clip (BABIP). Compare that to his .253 BABIP on ground balls, and .139 BABIP on fly balls (not including 7 homers). Hits aren’t good for a pitcher — and it looks like Cahill was giving more up.
Compare to his 2013 BABIPs: .674 on line drives, .211 on ground balls, and .175 on fly balls. Literally every kind of batted ball fell in significantly more frequently in 2014 than they did in 2015. And yet we have an indication from the ESPN Stats & Info hard hit stats that it’s probably not the case that every kind of hit was being hit harder — especially since Cahill’s hard hit rate didn’t go up.
Putting it differently: if Cahill’s downswing was caused by a dropoff in defensive efficiency and/or poor luck, this is exactly what it would look like.
Let’s turn to defense. A simple way to check on this is to see if the entire pitching staff saw a similar BABIP change on each type of batted ball; if that’s out of whack with HHAV, that difference would not be the fault of the pitchers, and it’s almost impossible that an entire staff was significantly unlucky for an entire season.
This isn’t a perfect method, in that it includes Cahill — whose effect on total innings is smallish, but whose big swing in BABIP versus HHAV is something we’ve already noted. In addition, the method is a lot less telling with respect to fly balls, since HHAV would include home runs on fly balls but BABIP wouldn’t. Still, it doesn’t look like there’s anything here.
To blame defensive efficiency, we’d be looking for changes in BABIP to be more positive than changes in HHAV. Instead, it looks like the D-backs were significantly more efficient at converting line drives into outs in 2014 than they were in 2013. We can’t say the same about ground balls — the team did do a little worse. But it looks like the team more than made up for that in being much more efficient at turning fly balls into outs (thanks, A.J. Pollock and Ender Inciarte!). There were more ground balls than fly balls, but the difference almost completely evens out.
So it’s probably not defense. If there’s a way to prove bad luck, I don’t know what it is; Cahill did have a left on base (LOB) percentage of 62.6%, which is quite a lot lower than his career LOB% of 71.8% or his 2013 LOB% of 73.5%. If it’s luck, we can really only point timidly in that direction, and only if we can more or less rule everything else out. But while the LOB% would be what it is if luck was at play, it’s also possible that we can blame Cahill for it.
I’ll share one other indicator that luck may be at play: Cahill’s results on ground balls with runners in scoring position. Remember, Cahill’s BABIP on ground balls rose a fairly significant 29 points between 2013 and 2014, but with runners in scoring position, BABIP on ground balls jumped from .216 to .390, a difference of about 5 hits in the 2014 context — those were almost all undoubtedly run scoring plays. And Cahill’s BABIPs in those situations had hovered in the low .200s in previous seasons, as well.
Inconsistency
I’m probably not alone in feeling like Cahill was a totally different person for different stretches, even within the same games. It seemed like either he was on and it was all working, or he’d lose the sinker and he’d look like any out was the result of divine intervention. But let’s see if the numbers back that up.
If this was a matter of losing command, walks — or better yet, balls — would probably be where we’d find that. I’m frankly not sure how to measure a pitcher’s “lumpiness” in terms of walks or balls, let alone how to compare whatever we came up with against the rest of the league. But we can at least make some educated guesses.
A walk here and there is not such a big deal; the only way to prevent them is to pitch in the zone almost exclusively, and that would be a poor strategy unless your stuff was literally unhittable. But sometimes, one would think, a pitcher would care more about walks. With runners on, for instance.
But we don’t find that with Cahill. In 2013, Cahill walked 9.5% of batters he faced when there were runners on, 8.3% in 2012. In 2014, he was right at the same level: 8.7%. It does appear, though, that this was a good thing to look at — the fact that all of these walk rates are a touch lower than his walk rate overall seems to suggest that he was trying to avoid walks in those situations.
I have no way of comparing this total to league average (that I know of), but I did go through the game logs to find instances of Cahill throwing multiple walks in the same inning:
3/22, 5th inning (walked two, then pulled in favor of Collmenter)
4/13, 3rd inning (walked three — first two walked runners stole a combined three bases in three separate plays)
4/26, 8th inning (after Joe Thatcher put a runner on with no outs — ROE — Cahill came in as a reliever and walked Marlon Byrd, sandwiched 4 hits around a strikeout, then walked another, but intentionally)
5/21, 12th inning (walk, double, and a very understandable intentional walk with the walkoff run on third)
5/25, 8th inning (walked two, then pulled in favor of Thatcher)
6/5, 7th inning (came in as the third pitcher in the inning with two outs, walked two, was pulled before third out)
8/15, 3rd inning (after walking Donovan Solano with one out, walked Giancarlo Stanton then closed inning with GIDP)
8/26, 4th inning (two walks to open inning, strike out, then five consecutive hits before getting pulled)
9/1, all game (in a six-walk, 4.1 IP performance, Cahill gave out two free passes in the third and two more in fourth — but, oddly, his last walk of the game was one he got as a hitter in the top of the fifth before giving up two hits to lead off the bottom of the fifth, getting yanked)
9/7, 6th inning (a homer-and-walk sandwich)
9/26, 2nd inning (two walks; first player scored on a GIDP)
That’s 12 multi-walk innings, and, oddly, 4 of them were at the hands of the Dodgers. If we back those 13 walks and 12 innings out of his totals, we’re left with:
12 multi-walk innings; 42 one-walk innings; and 56 no-walk innings — or something like that. Cahill had 110.2 IP for the season, but he pitched in something like 125 different MLB innings, what with getting pulled mid-inning and some of his relief appearances. That kind of distribution is well within what would be likely if they were a matter of chance.
No, we’re still at luck. The bad thing about that is we can’t necessarily explain it. The good thing, though, is that we don’t have a reason to think that his bad luck will continue — especially if increased shifting could help lower his BABIP on ground balls. Stay tuned.
If you enjoyed this article, please consider sharing it!


7 Responses to The Cause of Trevor Cahill’s Downturn
Leave a Reply
@ryanpmorrison
 Congrats to @OutfieldGrass24 on a beautiful life, wedding and wife. He deserves all of it (they both do). And I cou… https://t.co/JzJtQ7TgdJ,
 - Best part of Peralta’s 108 mph fliner over the fence, IMHO: that he got that much leverage despite scooping it out… https://t.co/ivBrl76adF,
 RT @OutfieldGrass24: If you're bored of watching Patrick Corbin get dudes out, you can check out my latest for @TheAthleticAZ. https://t.co/k1DymgY7zO,
 - Of course, they may have overtaken the league lead for outs on the bases just now, also...
But in 2017, Arizona ha… https://t.co/38MBrr2D4b,
- Prior to the games today, there had only been 5 steals of 3rd this season (and no CS) in the National League. The… https://t.co/gVVL84vPQ5,
Powered by: Web Designers@outfieldgrass24
- #Dbacks' 2018 1st round pick Matt McLain hit .203/.276/.355 as a freshman at UCLA last year. This season? A tidy li… https://t.co/yM48j1ebrr,
- RT @OutfieldGrass24: Who's that under the radar player who you are banking on to break out this baseball season? Someone who's not regularly in the headlines?,
- Just say "plague" already https://t.co/qkcwY2Omub,
 RT @wickterrell: You can certainly argue that he already has broken out, but I'm expecting massive things from Ramon Laureano this y… https://t.co/ejJPu9AEnd,
Powered by: Web Designers

Thank you so much for doing this. Looking at Fangraphs I think there’s something up with his sinker. It’s been steadily getting worse at inducing ground-balls which I think is very troubling. I don’t know if there’s a way to match pitch with HHAV but I’d bet, looking at the LD%, that it’s getting hit hard. His z-mov in the linked numbers above is as high as it’s ever been. It almost seems like the more vertical movement he gets with the pitch the worse the results. I’m wondering, with the increased vertical movement, if he’s having to start the pitch higher in the zone and maybe it’s easier for batters to pick-up. Just a theory. His change-up numbers are getting batted for a higher than ever LD% too. Again, thanks for your work. Great stuff.
rye — thanks for asking the question in the first place, I appreciate it.
PITCHf/x was the first place I went after you originally asked, and you’re dead right on the sinker getting hit hard. Here’s the weird thing, though — it didn’t seem like location mattered, and his other pitches had almost the exact same thing happen.
We can still sort that out — that was my impression when I was looking through it, but that was about a week before I sat down to write. Can always look more closely.
All these articles grinding numbers make reading about baseball BORING. Thank you for making me sleepy. At least now my insomnia has…….aldjf;ajdsfja;ldjljdl;a
Was there a measurable diff with tuffy vs miggy? I for one am happy we dont have to see miggy anymore.
[…] The Cause of Trevor Cahill’s Downturn […]
Your work is comprehensive and thorough. It takes sports and approaches elements of the competitive process like mechanical engineers dealing with stress or actuaries pricing risk. However, statistics do not always provide answers. This will take awhile and I doubt anybody will read it but we are talking about baseball. To hit line drives intentionally as a batter it helps to: shorten the hitting stroke, level the swing plane, choke up on the bat to permit more control of the bat’s sweet spot, and think of driving a spike into a solid surface giving maximum power to the point of contact and not to the follow through of inches beyond impact that home run swings are associated with. This formula is the way back for hitters in a slump, and was used often before the 1960’s on 2 strike counts. A pitcher in the major leagues gives up more line drives as a percentage of his thrown pitches because: he is throwing in a speed window that is narrow, i.e. he can be timed, he is not varying the angle of attack of his pitches thus making contact easier for the hitters, he is aiming his pitches, much like throwing darts he is pushing and not releasing the ball to flight- batters can see that, he has not developed either off speed or angle varying go to pitches so his pitching pattern is consistent making it easier for batters to hit their pitch, he does not control the plate, i.e. koufax was notoriously wild at first and the batters feared him forever, Bob Gibson threw inside at will, control of the plate sets up all sorts of advantages for the pitcher, finally pitching in front by having strike count advantage also helps. Cahill pitched controlled, he pitched timid, he was batting practice fodder. The pitching coach, Gibson, and Miggy, were not helpful. One of them should have been able to get him to pitch, to throw. Instead, they went the opposite direction and tried to focus on improving his control. Throw the ball with conviction, develop a different arm delivery angle, and work on out pitches. With last season being such a fiasco I can tell you it was not the line drives that got Cahill. It was the mental trap that he and his support system drove him into.
[…] did some fabulous work late last week when he dove head-first into what was behind Trevor Cahill’s downturn. As we know, there’s more than one way to be bad, more than one way to end up with a 5.61 ERA. […]