
It’s a magical time of year, the time in which mountains are made of molehills, common sense proves evasive and The People generally freak out. The Diamondbacks have sunk below .500 for the first time in 2016 as of this writing (hopefully they’ve “surged” to even in the standing by the time of this reading) and we’re all basically doomed. Zack Greinke forgot how to pitch. Shelby Miller did poorly and Patrick Corbin couldn’t keep Trevor Story from hitting baseballs to the good, paying patrons of the Chase Field bleachers. And at this point, why even bother? Because we could be talking about the Padres instead, that’s why. How much worse would life be if you’d lost your first three games by a combined tally of 25-0? So very much worse is the answer.
Jeff Zimmerman, who’s worth your follow on twitter, did a fun thing as he’s often wont to do. Zimmerman has tracked fastball velocities through the first four calendar days of the Major League schedule and noted their differences from 2015 counterparts. In doing so, we can see who’s added a few ticks, who’s holding steady and who we should be concerned about. Early in the year, pitchers are often still behind their velocity schedules (I’m pretty sure that’s not a real thing) as they stretch out and generally aren’t up to speed (zing!). So we should be unalarmed if guys are a one, maybe one-and-a-half miles per hour below their previous season marks. Any kind of a jump now could, conversely, show promise. So let’s see how the pitchers that have thrown in Arizona’s first three contests measure up.
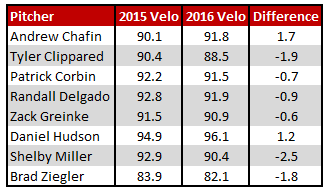
For clarity, these are “all fastballs tracked.” That means that if someone decided to throw more two-seamers than in years past, or more cutters, the velocity is naturally going to read a touch lower than if they relied primarily on four-seam heaters last season. And given the small sample (especially for relievers), maybe it’s hard to really make a fair comparison. So let’s make some unfair ones.
Chafin is the big winner here with nearly two more ticks than last year. Daniel Hudson looks good, too, picking up where here he left off in 2015. Brad Ziegler’s drop in velo is hardly any kind of concern — he does what he does. His velocity dipped last year and it didn’t jump up to start the season. Shelby Miller’s velocity declined in the second half last year, too, and it has clearly not recovered in his one start. A loss of 2.5mph is pretty darn significant and something worth watching.
Then again, we’ll see what happens in the next couple of weeks. It wouldn’t be surprise to see some of the velocity losers return more normal levels. It also wouldn’t be a surprise to see some guys that have added velocity continue to throw harder than we’ve seen. I’d caution against getting concerned just yet. Remember what time of the year it is. Early indicators are just that: early. There’s a long way to go.
If you enjoyed this article, please consider sharing it!


One Response to Double Plus: Earliest Season Velocity Reports
Leave a Reply
@ryanpmorrison
 Best part of Peralta’s 108 mph fliner over the fence, IMHO: that he got that much leverage despite scooping it out… https://t.co/ivBrl76adF,
  RT @OutfieldGrass24: If you're bored of watching Patrick Corbin get dudes out, you can check out my latest for @TheAthleticAZ. https://t.co/k1DymgY7zO,
 - Of course, they may have overtaken the league lead for outs on the bases just now, also...
But in 2017, Arizona ha… https://t.co/38MBrr2D4b,
- Prior to the games today, there had only been 5 steals of 3rd this season (and no CS) in the National League. The… https://t.co/gVVL84vPQ5,
- RT @OutfieldGrass24: Patrick Corbin has a WPA of .318 and it's only the fifth inning.,
Powered by: Web Designers@outfieldgrass24
- This Suns matchup comes at a good time for my hometown Blazers #RipCity https://t.co/fQ45wdfQUk,
 RT @ZHBuchanan: Our @Ken_Rosenthal spoke to Ken Kendrick about trading Paul Goldschmidt.
https://t.co/O5fHRlyBxD,
RT @ZHBuchanan: Our @Ken_Rosenthal spoke to Ken Kendrick about trading Paul Goldschmidt.
https://t.co/O5fHRlyBxD,  RT @CardsNation247: We have a good show lined up for tonight. Leading off is our friend of the show @buffa82 followed by Jeff Wiser… https://t.co/eltZC0uvyg,
  RT @juanctoribio: To piggyback off the @ZHBuchanan and @OutfieldGrass24 that the #Rays were involved in the Paul Goldschmidt sweepsta… https://t.co/spg9x7X1L5,
  RT @OJCarrascoTwo: Read this from the world famous, @OutfieldGrass24 https://t.co/cHUie1I5Le,
Powered by: Web Designers

Should of done early season location chart