Keys to Paul Goldschmidt’s Success: Improved Plate Discipline and Contact on Balls Inside
Paul Goldschmidt was an above-average hitter last season, putting up AVG/OBP/SLG numbers of .286/.359/.490. This season, he’s taken a big step forward in becoming a significant offensive force for the Diamondbacks, posting .292/.387/.534 marks. He eclipsed his 2012 mark for home runs on July 1st of this year, and he leads the National League in RBI with 106. In 2012, he created runs at an above-average clip (124 wRC+), but he’s been 51% better than the average hitter this year (151 wRC+, tied with Joey Votto for 8th overall).
So what’s the secret to Goldy’s improvement? I expected to find the answer in Goldy’s platoon splits, but didn’t find quite what I was looking for – I’ll post those findings over the weekend. I also took a look at Goldy’s plate discipline and swing rates, relying largely on maps from ESPN Stats & Information and statistics from ESPN and FanGraphs. I was a little surprised with the findings.
Plate Discipline
Goldy’s walk percentage has increased from 10.2% in 2012 to 14.8% this year. That lags behind the incredible Joey Votto (17.5%), but it’s still good for third among the 147 hitters qualified for the batting title. Had Goldy repeated last year’s 10.2% mark, he’d be tied for 42nd this year. That’s a pretty big jump.
But a player who receives more pitches outside the zone hasn’t necessarily exhibited better skill at laying off pitches outside the zone, and while anecdotal evidence is often the farthest thing from reliable, it has seemed to me this year that he’s been pitched around more. Walk rate tells a story, but it may be that Goldy’s swing rates are most telling.
Goldy’s overall swing rate has dropped, from 44.5% in 2012 to 41.7% so far this season. His zone swing percentage (Z-Swing%) has dropped only marginally, from 63.6% to 61.5%.
But Goldy has swung at pitches outside the zone (O-Swing%) 25.4% of the time this season, a drop from 29.4% in 2012. That O-Swing% dip may not seem like much, but as Crash Davis once famously opined, a difference of 5% (between a .250 and .300 average) can be all that separates mediocre from very good. Only 6 hitters (of 147 qualifiers) have an O-Swing% below 23%. Had Goldy put up a 29.4% rate again this season, he’d be tied with Jason Castro for 71th; instead, he slots in at 25th.
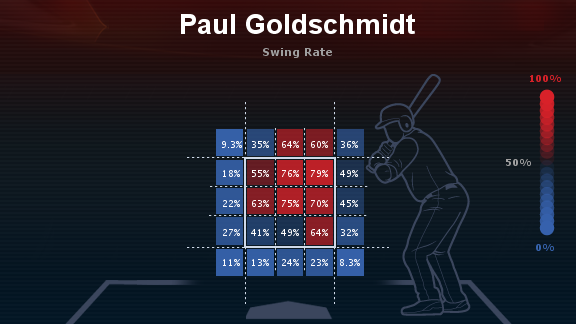
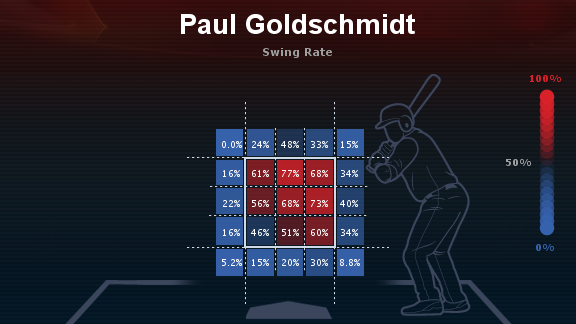
When you compare these maps of swing rates, it’s readily apparent that Goldy has cut down on his swing rate outside the zone (2012 first, then 2013 through the game of Sept 5):
So, yes, Goldy has swung less of the time at pitches outside the zone. With only one minor exception, each of the 16 boxes outside the strike zone show swing rates that are essentially the same or substantially reduced from 2012 to 2013. That’s the story that’s told by the 4% drop in O-Swing%, though.
Look at each of the four main directions off of the plate, and despite sample size issues I think we learn something. In both years, Goldy didn’t swing much at pitches below the zone or away from him. Above the zone, though? It looks like that’s where Goldschmidt’s selectivity has been most focused. In contrast, his selectivity didn’t change all that much inside. That’s pretty interesting.
Contact on Balls Inside
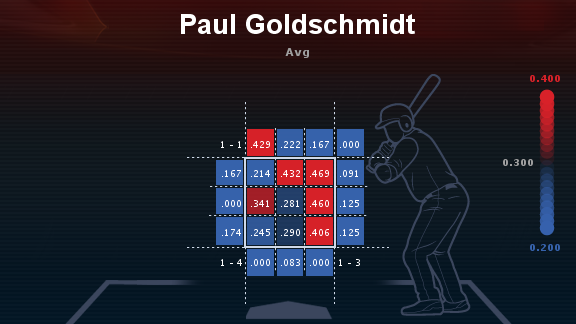
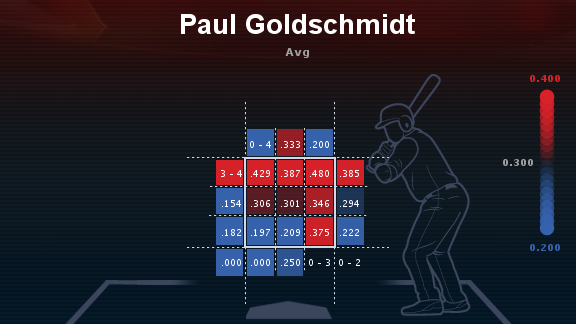
It may be that Goldy didn’t really cut down on his swings inside because he’s actually having some success. Consider the charts below with batting averages when Goldy puts the ball in play, which tell a stark tale (again, 2012 first, 2013 second):
In 2012, Paul Goldschmidt had virtually no success on pitches inside the plate. Despite that, he was swinging at a pretty good clip – nearly half the time in one box (top, 49%), even though his batting average on those pitches was .091. The other boxes inside (middle, down) were only slightly less awful for Goldy.
Goldschmidt hasn’t done better with inside pitches because he’s laying off of them a lot more – he’s doing better with them because he’s doing more with them. He’s hitting a respectable .294 middle inside, and an outstanding .385 top inside. Goldschmidt has always been a high ball hitter, but now you can’t really jam him – even if you come off the plate a bit, he can still kill you.
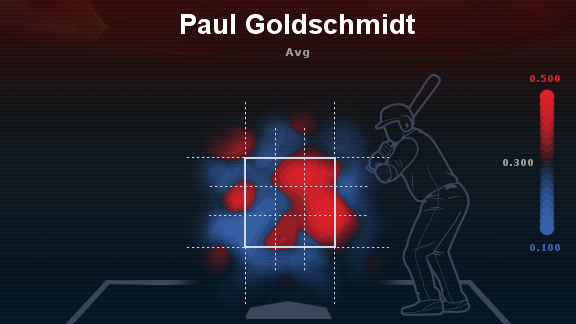
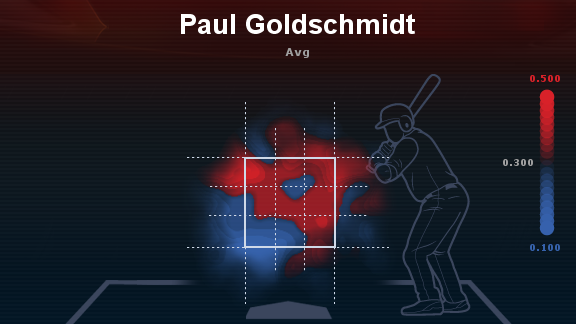
The success on balls inside and balls up and in may have come with a cost, however – Goldy isn’t doing as well reaching the far parts of the plate. You can see this in the charts just above, with batting average decreases on pitches down and away, down middle, and middle away. But it’s a little more obvious when you see it in heat map form:
Note how the 2012 heat map shows almost no red up and off the plate inside, but shows Goldy commanding middle down and down and in. The 2012 Paul Goldschmidt had really just one “happy zone” — it looks like he’s become more adept at moving the head of the bat in and out.
Working theory? Pitchers discovered last year that they could jam Goldy, and at the beginning of the year, he made an adjustment (the stance doesn’t look more open, so he may be standing a little bit more off the plate or just looking for pitches in). Goldy had a grand old time, perhaps until lately – it seems like he’s been getting a steady diet of pitches low and away in the last few weeks. It remains to be seen, maybe, whether Goldy can continue to make adjustments to stay ahead of the league – but he’s done a pretty good job of it so far this season.
4 Responses to Keys to Paul Goldschmidt’s Success: Improved Plate Discipline and Contact on Balls Inside
Leave a Reply Cancel reply
Recent Posts
@ryanpmorrison
 Congrats to @OutfieldGrass24 on a beautiful life, wedding and wife. He deserves all of it (they both do). And I cou… https://t.co/JzJtQ7TgdJ, Jul 23
 Best part of Peralta’s 108 mph fliner over the fence, IMHO: that he got that much leverage despite scooping it out… https://t.co/ivBrl76adF, Apr 08
 RT @OutfieldGrass24: If you're bored of watching Patrick Corbin get dudes out, you can check out my latest for @TheAthleticAZ. https://t.co/k1DymgY7zO, Apr 04
 Of course, they may have overtaken the league lead for outs on the bases just now, also...
But in 2017, Arizona ha… https://t.co/38MBrr2D4b, Apr 04
 Prior to the games today, there had only been 5 steals of 3rd this season (and no CS) in the National League. The… https://t.co/gVVL84vPQ5, Apr 04
Powered by: Web Designers@outfieldgrass24
 If you’re a coffee lover and haven’t f’d with @proudmarycoffee, I highly recommend it https://t.co/4NR0WePGQl, 21 mins ago
 RT @trailblazers: CARMELO ANTHONY
TIE GAME, 9 hours ago
 1B Christian Walker and C Daulton Varsho are a combined 4-10 for the @Aces tonight. Each has homered. 3B Drew Ellis… https://t.co/pnp2M0cujG, 9 hours ago
 I get it, but also, those are some strikes https://t.co/BH7zrkm9Ke, 12 hours ago
 OF Alek Thomas walked, tripled and homered yesterday for @sodpoodles. It was his seventh multi-hit game this month.… https://t.co/8TOberpO3t, May 26
Powered by: Web Designers



[…] Inside The Zona looks at Paul Goldschmidt‘s plate discipline this season. […]
[…] Inside The Zona looks at Paul Goldschmidt‘s plate discipline this season. […]
[…] could drive pitches in off the plate. For good reason: as I found in early September of last year, one thing that fueled Goldy’s breakout in a big way was a much better contact percentage on pi…. He was swinging at those pitches more not just because runners could be driven in, but because he […]
[…] When he first came up, Goldy dominated the inside third of the plate; but it wasn’t until he dominated the whole top of the zone, as well, that he broke out in 2013. Things are not so dire in 2015 as when he hit just .197 low […]