
Even in a subpar season in which they rank just 26th in the majors in on-base percentage and 29th in walks (worst in the NL), the D-backs have had plenty of base runners. The D-backs have the worst base running marks in the National League, however, and being more aggressive could pay serious dividends in propping up the team’s runs per game ratio, which is also just 26th in the majors.
Thanks largely to being 8th in the majors in total hits (458), the D-backs have had a solid 583 base runners so far this season. What those base runners have done once getting on is far less impressive. Small sample size caveats apply, but check out these numbers from Baseball Prospectus:
![]()
BRR is the catch-all statistic that Baseball Prospectus uses for base running runs, as compared to the average team. The component statistics measure runs above (or below) average on the basepaths due to:
GAR: advancing on ground outs 10
SBR: stolen bases/caught stealings 5
AAR: advancing on outs on balls caught in the air 7.5
HAR: advancing on hits 7.5
OAR: other advancement runs (wild pitches, passed balls, balks) 2
The least significant of these component statistics is OAR, but you might be surprised to find out that SBR is the next-least significant. I’m measuring that just by comparing the best team to the worst team in each category; by that method, how well a team advances on ground outs (GAR) makes the biggest difference for base running runs, with advancing on air outs (AAR) and hits (HAR) roughly tied for second.
Wouldn’t you know, the one that matters the most is the one for which the D-backs have been the worst in the majors. And this isn’t just bad luck this season; the D-backs also fared poorly in GAR last season (-6.89, 26th) and in base running runs overall (-9.7, 28th). They got that -6.89 GAR mark in 533 opportunities, which led the majors last year. The D-backs have played almost a third of the season (they hit that milestone tonight), and yet they have just 150 GAR opportunities so far this year. That means that despite being on a pace for about 80% of the opportunities they had last year, the D-backs are on a pace for more than double the harm in failing to advance on ground balls (or in getting out while trying to advance). That’s not good, and that doesn’t appear to be a product of a slow-footed team.
GAR is only calculated for when a runner is on the bases by himself, and when the ball is fielded by an infielder without a hit or error recorded (and with less than two outs, obviously). Managers play a role in GAR totals, with a hit and run one way for a runner to advance farther than expected on a ground out. And this does appear to be a team issue; the slow-footed Miguel Montero is not doing very well on the bases in general, but it’s odd to see Aaron Hill, Chris Owings, and Cliff Pennington all put up poor numbers. The only D-backs player to have done particularly well this year in GAR is A.J. Pollock with 1.05, and he’s also led the pack in opportunities. Paul Goldschmidt is a distant second in GAR, although he’s also leading the team in BRR overall.
By the way: say what you want about Gerardo Parra, but despite not doing so hot in SBR, he’s been helpful running the bases. This year he’s ahead of Pollock and behind only Goldschmidt in BRR, and last year he was 5th on the team in BRR (behind Pennington, Pollock, and the departed Willie Bloomquist and Adam Eaton). It’s Martin Prado that we have to keep an eye on, maybe: he was the worst base runner on the team last year (-5.6 BRR), and he’s not doing so hot this year, either (-0.5 BRR).
But back to the team numbers. Runners have scored 29% of the time in baseball so far this season, and the D-backs’ 28% rate is nothing to cry about, especially considering the team’s rank in OBP. Spot-checking individual situations, nothing sticks out to me as particularly out of place. D-backs base runners have a 72% success rate in stolen base attempts, which is not great but again just under league average (74%). They also attempt steals in SB opportunities about as often (5.3%) as league average (5.7%).
And as for advancing on hits, we already saw that the D-backs do fairly well. D-backs runners have scored from second on singles 36 times in 56 opportunities (64%), which is again comparable to league average (61%). The same could be said for advancing to third or home from first on a single (29%, versus 29% for league average), and for scoring from first on doubles (44% in a very small sample, versus 41% for league average). All told, the D-backs have an “Extra Bases Taken” percentage of 43%, ahead of the league average rate 41% but still far behind the head of the pack (51% for the Brewers, 50% for the Angels, and 49% for the Mariners).
Could the D-backs convert these opportunities at a better rate, however? The D-backs have run into 5 outs this season while trying to score, and there’s a good argument to be made that this number is too low.
Look at those “advancing on hits” numbers again, this time comparing success not just to the lack of success, but to the type of lack of success:
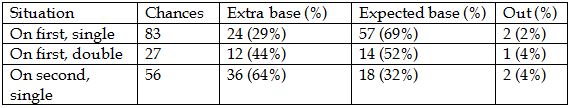
What should really stand out is that there are essentially no outs made in these situations. Outs are definitely bad. But bases are good — especially in the last two types of situations above, in which the extra base in question is home plate. These aren’t the only situations in which runners advance — as we saw above, runners’ advances on ground balls and balls caught by outfielders are at least as meaningful as their advances on hits. But it’s a good way to isolate a principle.
Hypothetical: You’re the third base coach. Runner on second, two outs, and the hitter at the plate belts what looks to be a single. Your snap second read of the situation is that the runner has a 50/50 chance of scoring. Assume that the score doesn’t play into the consideration. Do you send the runner?
I’ve asked this question before, but the “right” answer is yes. Why? Because 50/50 is better than the alternative.
The alternative depends a bit on who’s coming up to the plate. Is it a particularly weak hitter with a batting average of .200 and an on base percentage of .250? Well then there’s a 20% chance the runner would score from third on the next play. There’d also be a 5% chance of a walk, in which case the torch would get passed to the next batter. But there, the next batter would be at the plate with the bases loaded, so all that matters is on base percentage. If the next hitter was also pretty bad with an OBP of .250, that’s 25% of the 5%, or 1.25%, for a total chance of 21.25% of the runner scoring eventually if not on the running play.
Make the next two hitters as good as possible, with batting averages of .350 and OBPs of .425. In that case, there’d be a 35% chance of the runner scoring in the next at bat, as well as a 7.5% chance that the torch would get passed to another hitter. That other hitter would have a 42.5% chance of plating the runner in question, and so all told, the runner would have about a 38% chance of scoring if not on the running play.
50% is greater than 38%, and 38% is the best-case scenario for an alternative. So when there’s two outs and there’s a 50/50 chance of a runner scoring if he’s waved home… he really should be waved home.
We don’t know what Glenn Sherlock was thinking about the chances of runners scoring, but he’s already had 56 chances to send a runner who was on second when a single was hit. The runner went for it 38 of the 56 times (68%). The runner was successful 95% of the time.
Having that success rate be high is good because outs are bad. But it’s probably too high, because being left on base to end an inning is also bad. Not all of those situations played out with two outs, but about half of them did if they followed 2013 patterns (9,351 of 18,769 times there was a runner on third in 2013, it was with two outs). The high success rate pretty much guarantees that not enough of the runners were sent.
With average hitters in the lineup, a runner on third can expect to score about 86% of the time with no outs, 66% of the time with one out, and just 29% of the time with two outs. That huge gap means that with no outs or even one out, teams would be correct to be conservative most of the time. But with two outs, it makes sense to send a runner even if the third base coach thinks there’s only a 35% chance of success. So here’s our reasonable demand.
Reasonable demand: be more aggressive in sending runners home with two outs, such that the runner is thrown out about 50% of the time, instead of 5% of the time.
Of 583 base runners so far this season, just 5 have been out on base at home, trying to advance. Considering the percentage of the time that such runners trying to advance were trying when there were two outs in the books, however, the fact that that number isn’t higher is a sign that not enough runners have been waved home. With two outs, getting a runner gunned down at the plate is not so vile a sin as leaving him at third at the end of the inning.
If you enjoyed this article, please consider sharing it!


@ryanpmorrison
 Congrats to @OutfieldGrass24 on a beautiful life, wedding and wife. He deserves all of it (they both do). And I cou… https://t.co/JzJtQ7TgdJ,
 - Best part of Peralta’s 108 mph fliner over the fence, IMHO: that he got that much leverage despite scooping it out… https://t.co/ivBrl76adF,
 RT @OutfieldGrass24: If you're bored of watching Patrick Corbin get dudes out, you can check out my latest for @TheAthleticAZ. https://t.co/k1DymgY7zO,
 - Of course, they may have overtaken the league lead for outs on the bases just now, also...
But in 2017, Arizona ha… https://t.co/38MBrr2D4b,
- Prior to the games today, there had only been 5 steals of 3rd this season (and no CS) in the National League. The… https://t.co/gVVL84vPQ5,
Powered by: Web Designers@outfieldgrass24
- Look who got his first haircut today https://t.co/AKB91gaToB,
- When the ivermectin hits in the middle of a press conference https://t.co/lJhsVUKeQJ,
- Did we even figure out if Kendall Graveman is actually good? And like, aren't deals of this size for non-elite reli… https://t.co/7tWsYWdcLv,
- Old friend alert https://t.co/0txQiPvYxs,
- Ah yes, French breakfast food https://t.co/xiEtZsZBXw,
Powered by: Web Designers
