
In 2014, working the count was not a strength of the D-backs. At 3.76 pitches per plate appearance, the team’s batters trailed all but two other teams in the National League, although they were nearly as close to the league leader (Cubs, 3.88 Pit/PA) as they were to the team with the quickest plate appearances (Brewers, 3.65 Pit/PA). Despite a similar total of plate appearances, the D-backs saw 770 fewer pitches than the Cubs.
A difference of 3% in total pitches seen may not seem like a whole lot. It’s not, and yet it’s more important than it may seem. Teams largely stick to target pitch counts for starters. Setup men pitch about as often as teams are willing to use them, and even when a string of losses or blowouts leads to a closer being pitched just to get work in, that typically comes in the ninth inning.
The 3% difference in total pitches seen matters because of who might have thrown those pitches: middle relievers, long men, types that might never see a major league mound on a day where things go according to plan and a team gets seven strong innings from a starter. Run scoring follows a pattern; other than first innings, when the top of the lineup is always due up, run scoring is highest in innings 4 through 6, with the next-highest totals in innings 3 and 7.

At the team level, our sample of 162 games is a lot less reliable than it is at the MLB level. But note that in first innings, the D-backs did just fine; their .49 average runs was identical to the MLB average, if a hair under the NL average. The dip in the second inning across the sport is almost definitely due to the higher likelihood that the bottom of a team’s lineup will bat; taking those two innings together, the numbers seem to suggest that the D-backs were just fine at the top of the lineup, but had a below average bottom of the lineup even as compared to other NL teams.
Note, though, the wide gaps in that innings 4 to 6 window. And while the team did particularly well in the last two innings, that may be a symptom of the very phenomenon we’re talking about: seeing mediocre pitchers is valuable. For a great team, those opportunities are likely to come in the main window, and in the seventh inning; for a team like last year’s Diamondbacks, those opportunities may come at the end of games, when an opposing team already feels like it has the game locked up. Entering the 8th inning, NL teams were behind just 44% of the time (as opposed to ahead or tied). Arizona was behind 52.5% of the time, staying behind when the inning was over in 77 of those 85 games despite their uptick in run scoring, a pretty strong indication that the run gap tended to be large.
There is one other thing at work in the above graph: the times through the order penalty (“TTOP”). Essentially, pitchers always do worse the more they cycle through a lineup, doing particularly well the first time through (as compared to what is expected, given the quality of pitchers faced) and particularly poorly the third or fourth times through. That’s a real thing, and it helps to obscure the difference between facing a starter or a reliever in, say, the fifth inning. Chances are that if a starter is not doing so well, he’s probably reaching a TTOP earlier in the game. For our purposes, though, that doesn’t really matter: it’s more of a function of hitters not getting outs (or on base percentage, really), and less of a function of hitters’ individual pitch counts getting high.
Still, pitch counts matter, and they matter in and of themselves in addition to correlating highly with on base percentage (you need to see at least four pitches to get a walk, after all). And in that context, it may be that things are looking up.
Compare last year’s 13 position players with over 200 PA with the career Pit/PA numbers of 12 players likely to play frequently:
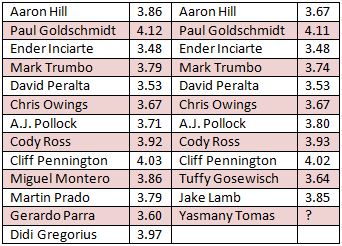
There’s some cause for optimism here: the three players with the highest P/PA last year who are still around have sustained those levels for a few seasons, and are likely to keep them. Aaron Hill‘s seems likely to drop a bit, but probably not all the way back to career average; he’s had P/PA rates over 3.7 for four years running. A.J. Pollock‘s rate may stay down, but only if he and his coaches think that a more aggressive approach was part of what made his breakout happen — and it’s unlikely to drop even further. Gone is Didi Gregorius and his scrappy P/PA, but so is Gerardo Parra‘s, a net positive. Jake Lamb‘s P/PA in his short 133 PA career is high enough to help prop up the team P/PA, and while Tuffy Gosewisch has an unusually high first pitch strike rate, he doesn’t give away at bats, either.
That said, it’s likely that Ender Inciarte will get a similar PA total this season (he was fourth on the team with 449), and despite what became a respectable on base percentage, he didn’t show a particularly patient approach last year. Yasmany Tomas is a complete mystery in this case, although in my small window of seeing him hit last week, he seemed content to try squaring the ball early in counts, even if that came on difficult pitches and resulted in soft liners. Cody Ross may retain his high P/PA, but probably not a realistic shot at 200 PA this season.
There have been meat grinder lineups in the past, where offensive success was not the only thing valued and players were added to, say, the 2013 Red Sox because of an ability to work the count. P/PA can help a team get to the soft underbelly of an opposing team’s pitching staff, but nothing does that better than OBP — getting additional plate appearances just matters more. The Padres were 6th in the NL in P/PA last season, and yet was 13th in Pitches Seen because they were dead last in PA.
Last year, the D-backs were 11th in OBP, and 13th in P/PA — settling in at 10th in Pitches Seen, thanks in part to some extra innings and ranking 9th in PA. My past research on the 2013 season suggests that P/PA really only makes a difference if it’s particularly high or particularly low — given the current roster, there’s no way to turn P/PA into a meaningful strength. That’s okay, though. The D-backs should keep an eye on working counts to make sure that they don’t slip to the point of it being a problem. Beyond that, though, this is something they really shouldn’t worry about: just like what may have been the case with Pollock last season, coaching players on whether to be more aggressive or more patient should be all about what will help that particular player succeed.
If you enjoyed this article, please consider sharing it!


2 Responses to Working the Count: Forget About It (And Don’t Feel Guilty)
Leave a Reply
@ryanpmorrison
 Congrats to @OutfieldGrass24 on a beautiful life, wedding and wife. He deserves all of it (they both do). And I cou… https://t.co/JzJtQ7TgdJ,
 - Best part of Peralta’s 108 mph fliner over the fence, IMHO: that he got that much leverage despite scooping it out… https://t.co/ivBrl76adF,
 RT @OutfieldGrass24: If you're bored of watching Patrick Corbin get dudes out, you can check out my latest for @TheAthleticAZ. https://t.co/k1DymgY7zO,
 - Of course, they may have overtaken the league lead for outs on the bases just now, also...
But in 2017, Arizona ha… https://t.co/38MBrr2D4b,
- Prior to the games today, there had only been 5 steals of 3rd this season (and no CS) in the National League. The… https://t.co/gVVL84vPQ5,
Powered by: Web Designers@outfieldgrass24
- Starting 2022 with a frigid dog walk sounds just lovely https://t.co/xoLZSZBpGp,
- I’ll never forget seeing Kyle Seager at the Scottsdale Fashion Square one March with his family and thinking “damn,… https://t.co/uapNYdsU2a,
- Big dogs. Bigger trees. @ Avenue of the Giants, Nor Cal https://t.co/YAdxcE1t1p,
- Old friend alert https://t.co/7HQjiyBWTB,
- Death wish https://t.co/XJzcMkNPTy,
Powered by: Web Designers

I don’t know. This is tricky. Guys like goldy work the pitch count because they will have tendency to get the calls, but also you obviously want him to expand the zone at times. Id prefer a guy lamb to do the same. Ill develop this in a week. Then you guys can datorize it.
Ok, cool. And I would like to think a bit more about whether we have any tools that would work re: guys having tendencies to get more calls than others.