Driving the Bus: The D-backs’ Penchant for Hard-Hit Singles
671 runs scored through last night puts the D-backs 6th in the majors, but second in the National League (1 run behind the Nationals). With Paul Goldschmidt right at the standard he set for himself at 2013, A.J. Pollock bettering his 2014 performance, and David Peralta in full breakout mode, all it’s taken is solid or better performances from most of the remaining hitters, Welington Castillo, Jake Lamb, Yasmany Tomas and Ender Inciarte among them. Still, the D-backs rank 19th in baseball with 140 home runs, almost exactly average for an NL team. It’s not your classic power offense.
And yet it is a power offense. Batting Average on Balls in Play speaks volumes, it turns out. Other than foot speed creating some extra infield hits, we used to think the main thing that affected BABIP was Line Drive Percentage, as line drives turn into hits about 70% of the time, everything else in the 20% range. The reason we still ascribed most BABIP fluctuations to luck was that you can’t actually control line drive percentage that well. So far this season, the difference in LD% between the first-place team (Phillies, 22.3%) and last-place team (Rangers, 19.1%) is just three percentage points. Over 400 balls in play, that’d be a difference of 12 batted balls — and only 6 or so hits. Meaningful, but not likely to move the scales that much. The D-backs rank 14th in LD%.
With a quantity of batted ball exit velocity data now available, it’s becoming clear that how often a hitter hits the ball especially hard is both something he can control, and something that makes a tremendous difference. That’s a big part of what makes Lamb tick; driving the ball was also the driving force behind Peralta’s surge around July and August. Take my word for it. In the last issue of D-backs Insider this year (available at Chase Field during the last homestand of the season), Jeff and I are publishing some pretty astonishing research into the connection between AVG and SLG and exit velocity, illustrating something that Lamb, Peralta and Yasmany Tomas do particularly well with data provided by Daren Willman of Baseball Savant. A.J. Pollock is also profiting from the same phenomenon, just not as much; and it is a huge part of Goldy’s game.
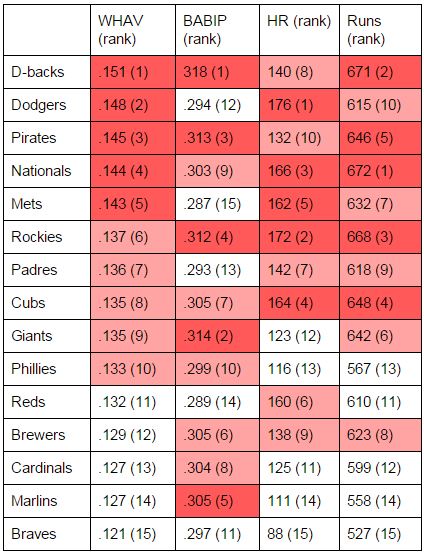
This year, hitting the ball hard has been the D-backs’ special sauce. Despite ranking 19th in home runs, the team is 9th in doubles and 3rd in triples. That’s part of what makes hitting the ball hard effective. Courtesy of ESPN Stats & Info, we have data on the frequency with which teams have hit the ball especially hard (Well Hit Average, or WHAV) and especially softly (Soft Hit Average, or SHAV). The D-backs have a pretty big advantage in WHAV (.151, 4th overall, league average .136) and in SHAV (.357, 5th overall, league average .381).
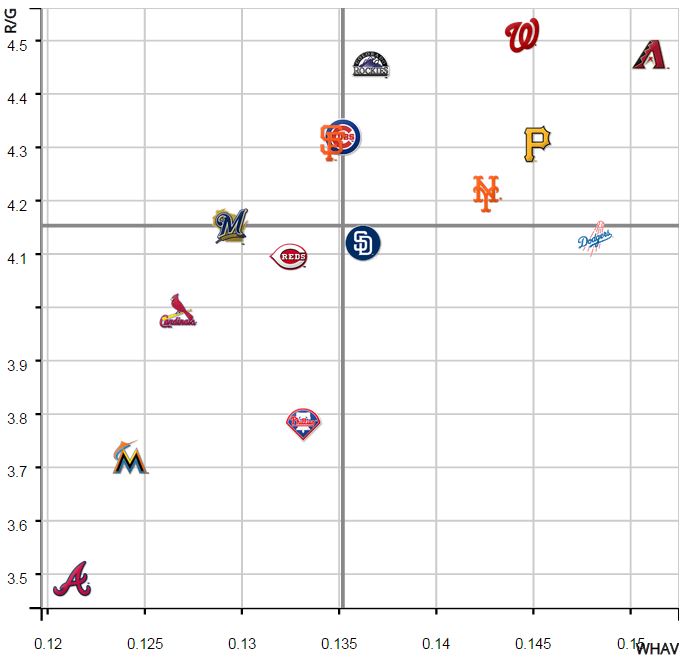
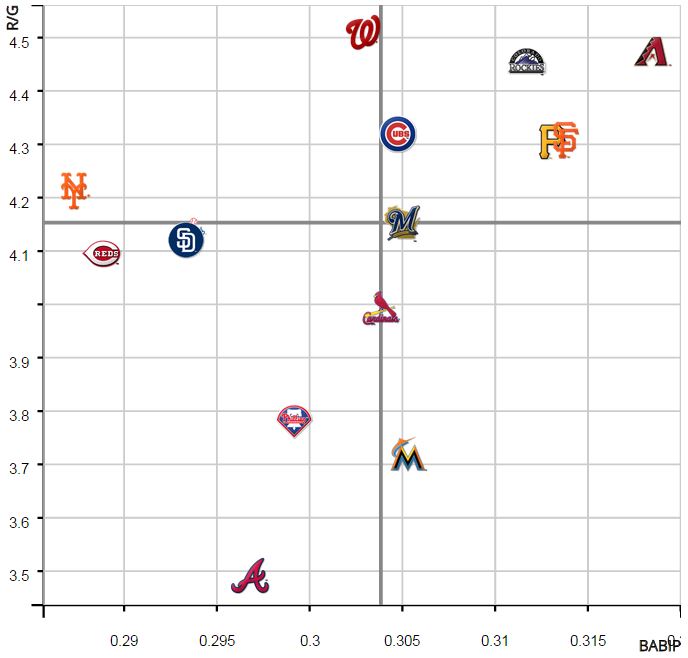
There’s a pretty strong relationship between WHAV and runs scored, stronger or about as strong as home runs (you can kind of tell from the shading). BABIP, on the other hand — not quite so much. You can eyeball this, really; the below scatter plot from ESPN Stats & Info shows runs per game (Y axis, higher is better), and WHAV.
Compare with BABIP:
Hitting the ball hard is helping the D-backs get extra base hits, and also helping them turn batted balls into hits; but that’s not enough to get them atop the column on the right in the table above. There’s something else going on here — and it has everything to do with outs, and with singles. The D-backs are leading the NL in singles, and it’s not all that close; and yet despite having an especially high number of their baserunners on first base, The D-backs lead the NL with 31% of baserunners scoring.
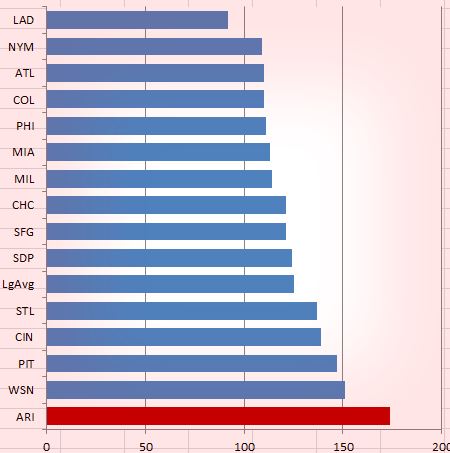
It has everything to do with driving the bus. With men on base, the D-backs are still the cream of the NL crop in WHAV with .151, ahead of the league average WHAV in those situations, .137. Zero in on a subset of those situations in which the team has put the ball in play, and WHAV rockets up to .194 for Arizona and .176 for the league. 20 points or so may not seem to make a difference, but we’re talking about nearly 2,000 balls in play per team at this point. It adds up, and with the help of some keen baserunning, it adds up to a ton of “bases taken,” each base one that we would not have expected a runner to take:
Not super concerned about how these guys haven’t hit a ton of home runs. The great thing about this is that it’s based on skills that are looking very solid now; to the extent anything in baseball is consistent, those hard-hit skills seem to be something that hitters are able to repeat year after year.
One Response to Driving the Bus: The D-backs’ Penchant for Hard-Hit Singles
Leave a Reply Cancel reply
Recent Posts
@ryanpmorrison
 Congrats to @OutfieldGrass24 on a beautiful life, wedding and wife. He deserves all of it (they both do). And I cou… https://t.co/JzJtQ7TgdJ, Jul 23
 Best part of Peralta’s 108 mph fliner over the fence, IMHO: that he got that much leverage despite scooping it out… https://t.co/ivBrl76adF, Apr 08
 RT @OutfieldGrass24: If you're bored of watching Patrick Corbin get dudes out, you can check out my latest for @TheAthleticAZ. https://t.co/k1DymgY7zO, Apr 04
 Of course, they may have overtaken the league lead for outs on the bases just now, also...
But in 2017, Arizona ha… https://t.co/38MBrr2D4b, Apr 04
 Prior to the games today, there had only been 5 steals of 3rd this season (and no CS) in the National League. The… https://t.co/gVVL84vPQ5, Apr 04
Powered by: Web Designers@outfieldgrass24
 #Dbacks' 2018 1st round pick Matt McLain hit .203/.276/.355 as a freshman at UCLA last year. This season? A tidy li… https://t.co/yM48j1ebrr, Mar 07
 RT @OutfieldGrass24: Who's that under the radar player who you are banking on to break out this baseball season? Someone who's not regularly in the headlines?, Mar 06
 Just say "plague" already https://t.co/qkcwY2Omub, Mar 06
 RT @wickterrell: You can certainly argue that he already has broken out, but I'm expecting massive things from Ramon Laureano this y… https://t.co/ejJPu9AEnd, Mar 06
Powered by: Web Designers


Great stuff. Our offense and position players are very solid. I think we’ll have a top of the line offense and defense throughout the 2016-2018 window. Now we just need pitching…