
On his return from the foot injury that cost him nearly two months, Jake Lamb did not have a good June: .224/.278/.313, not great but not exactly awful, either. In the two weeks following his return, Lamb collected just 6 hits and 3 walks in 42 PA. Since then, though, Lamb has been on a slow burn that now has him on fire. The Rake Man is back.
The way a brilliant spring training catapulted Lamb into his brief .414/.514/.690 April, maybe we should have expected that Lamb would need some time on his return. For our purposes, Lamb’s June is just as real as his April. But that’s okay — because as things stand in early August, his .287/.345/.441 line makes him one of the lineup’s most important hitters. Add everything up together the right way, and you have an above average 113 wRC+ — about as far ahead of Yasmany Tomas (104 wRC+) as he is behind A.J. Pollock (123 wRC+). But like Pollock, Lamb has done it while providing premium defense at a skill position on the field — scale the numbers up based on playing time, and Lamb’s defense has been worth as much to the team as Pollock’s, and maybe a smidge more. Not quite Nick Ahmed territory, but that is rarefied air, right?
Overall, Lamb is playing like a 5 WAR player this season, which is well beyond “helpful player” and into “perennial All Star” territory. The D-backs have kept him away from lefties, so we can’t just act like he could produce at the same pace over 600 PA. That’s why I said 5, though — at 1.9 WAR over 206 PA, we’d be looking at more like 6 wins. Cripes.
How is he doing it? After all, his 24.8% strikeout rate isn’t exactly something to brag about.
Why, a .373 BABIP, of course.
WE TOLD YOU. Here, but also, definitely, here.
It’s a tradeoff, really: you can have a high contact rate, you can swing hard, but you better do one, and you can’t really do neither. Lamb’s signature in the minors were these excellent BABIPs, .371 or higher at all three of his longest stops (including .389 at Double-A, where he played most of last season, as you will recall). You don’t get that lucky for three years in a row. And while it was unlikely he’d sustain that in the majors — so far this season, only five players have a BABIP over .370 — it’s still his signature.
We have something more to look at this season: batted ball velocity data, courtesy of MLBAM and Baseball Savant. Suspecting that the D-backs’ home park does unusual things, let’s restrict ourselves to D-backs batted balls, put them in different buckets by velocity, and then see whether Lamb’s BABIP is supported by stinging the ball. With batted balls segregated into 105+ mph, 64 mph and under, and in five mph increments in between:
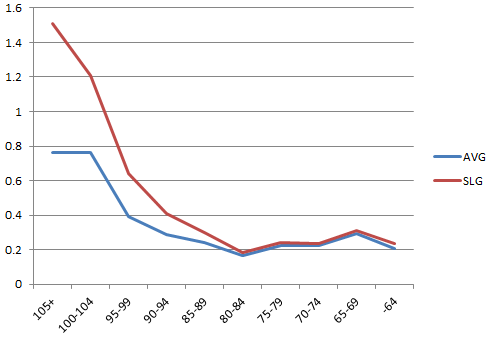
As expected, batting average on all batted balls looks much, much better at the high end of exit velocity; in each of the D-backs’ top two buckets, they’ve had a batting average of exactly .765, which is something of a coincidence. That batting average, though, is strikingly similar to the one we generally use for all line drives. It’s unlikely that batting average could ever go much higher than that, even if a hitter could somehow start smashing the ball at 130+ mph — there’s some tax for there being some fielders standing around, and no matter how fast you are, if you hit it right at someone, chances are pretty good it’ll turn into an out.
Notice that I said batting average on all batted balls. BABIP is fun, but we’re trying to figure out how legit Lamb’s success is. BABIP is/has been a tool to filter out luck caused by the placement of a ball on the field, of difference in ability level of hitters, etc. We can do better, now, I think, with batted ball velocity data. So we’re not using BABIP the same way, and there’s no need to cancel home runs from our analysis just because fielders aren’t involved. Home runs are in here.
Hence the enormous spike in slugging percentage at the upper end of the graph. Over 1.000, hitters have collected more bases via hits than outs; that threshold appears to be right around the 100 mph mark (fun coincidence, eh?). That’s part of the fun of hitting the ball hard. Sure, it means putting fewer balls in play, and you may not get all of that back in batting average from an increased BABIP. But if it’s close, you prefer the extra bases, right?
Here’s Lamb’s version of the graph above. Note: small sample size caveats apply here, in not a small way.
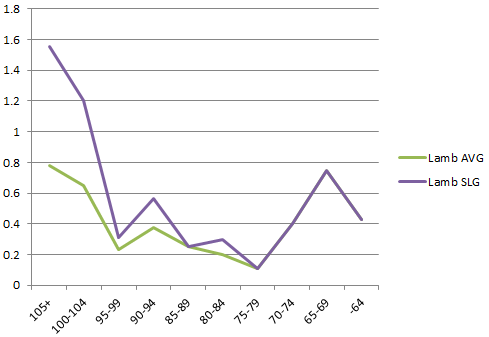
What this tells us: Lamb isn’t getting lucky, but may even be getting cheated a bit. His batting average 100-104 mph isn’t quite as high as we’d expect (.650, unlike the D-backs’ total, .765), but there’s a big dropoff between this green line and the blue line above for batting average on 95-99 mph (.231 for Lamb, .395 for D-backs). Lamb has just 4 batted balls between 65 and 69 mph, so that spike on the right isn’t very meaningful.
The real trick is how many balls are in each bucket. If the trends hold, then by hitting more batted balls on the left (high velocity), you’ll reap very significant rewards in batting average. The whole of the first graph is mediocre batting averages with small differences, until you reach 95+ mph, when things get fun.
Indeed, Lamb has done exactly what we inferred he’d do from his ridiculous minor league BABIPs. Yes, small samples. But when we predict something unusual and then 101 batted balls show the very same thing, that’s still pretty helpful, right?
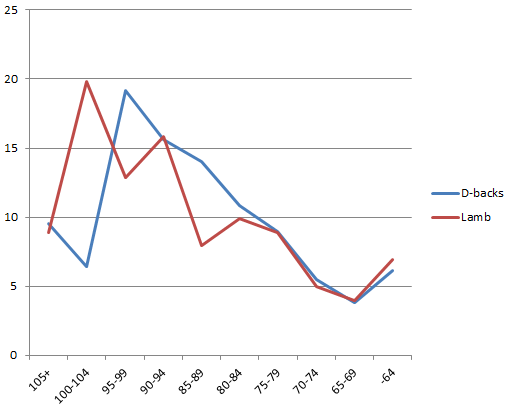
A perfect version of this graph would have the blue line in the shape of a bell curve, or something like that; we might have segmented the batted balls based on how closely they were grouped in the middle. As it is, the lines show percentages of batted balls in that velocity bucket. For the D-backs as a whole, 19.14% of batted balls tracked by MLBAM and reported at Baseball Savant have been between 95 mph and 99 mph. 90-94 is a close second at 15.6%, 85-89 14.0%, etc. Note that the blue line here spikes up at the on both sides, but that’s because I stopped using 5 mph buckets; if we had kept going with ever-smaller samples, the blue line would decline gently at the beginning and the end.
This graph is everything. Remember, because these are percentages, for the line to be up on another in one area, it has to be down in another area. And it all happens in that 100-104 mph bucket.
19.8% of Lamb’s tracked balls have been in that bucket; just 6.4% for the D-backs in general. In trade, Lamb has smaller percentages of batted balls in that 95-99 mph bucket, and the 85-89 mph bucket. Or, to go back to our very first graph: Lamb basically took over 13% of his batted balls and moved them from .244 average and .395 buckets to that big, beautiful .765 batting average bucket.
We are not talking about a ton of batted balls here. This could change pretty easily, although it is already the case that Lamb is unlikely to have a low BABIP once the season is complete. This is who we thought he was: solid defensively, with some swing and miss to his game but some extra hits (and extra extra base hits) to show for it. If Lamb isn’t done growing — and by rights, he might have spent all of this season in Triple-A — we might be looking at a hitter second only to Goldy. That might be true as soon as right now.
If you enjoyed this article, please consider sharing it!


11 Responses to Jake Lamb is Better Than You
Leave a Reply
@ryanpmorrison
 Congrats to @OutfieldGrass24 on a beautiful life, wedding and wife. He deserves all of it (they both do). And I cou… https://t.co/JzJtQ7TgdJ,
 - Best part of Peralta’s 108 mph fliner over the fence, IMHO: that he got that much leverage despite scooping it out… https://t.co/ivBrl76adF,
 RT @OutfieldGrass24: If you're bored of watching Patrick Corbin get dudes out, you can check out my latest for @TheAthleticAZ. https://t.co/k1DymgY7zO,
 - Of course, they may have overtaken the league lead for outs on the bases just now, also...
But in 2017, Arizona ha… https://t.co/38MBrr2D4b,
- Prior to the games today, there had only been 5 steals of 3rd this season (and no CS) in the National League. The… https://t.co/gVVL84vPQ5,
Powered by: Web Designers@outfieldgrass24
- Old friend alert https://t.co/6X2Su6PKrf,
- This is going to be fun and I hope you join us! #Dbacks https://t.co/YWfD7ymupf,
 RT @TheRattleAZ: 🚨 LIVE VIDEO SHOW TOMORROW AT 7 PM 🚨
Join @OutfieldGrass24 and @JesseNFriedman tomorrow night at 7 PM for a… https://t.co/E9X6m7HeUV,
RT @TheRattleAZ: 🚨 LIVE VIDEO SHOW TOMORROW AT 7 PM 🚨
Join @OutfieldGrass24 and @JesseNFriedman tomorrow night at 7 PM for a… https://t.co/E9X6m7HeUV, - Disgusting. Absolutely disgusting. https://t.co/xIPKxM4viX,
 RT @cdgoldstein: What are minor league teams doing to make a mark on their community without a minor league season? @OutfieldGrass24… https://t.co/4Kp6mVa0eC,
Powered by: Web Designers

Ryan,
Do you have any reservations with his defensive stats given such a small sample size? UZR/150 has him pegged as a top 5 defensive 3B, and his UZR is really driving up his WAR. I think that might be a bit bullish. DRS has him rated below average. It’ll take some time to get a more accurate reading of his defensive value. I will say that he looks above average to the eye.
Definitely, way too small to bank on the data. But I agree — he looks really fantastic over there.
For what it’s worth, the counting version of these stats also make him look fantastic. He’s converted nearly 80% of balls in his zone into outs, a .796 UZR that ranks second among all third basemen with at least 200 innings this season (Lamb has 409). Manny Machado has a .799 RZR, but there aren’t too many Machados out there. Average for the position is .717, and by the time you get to guys ranked 13-14, you’re already down to .740 or so.
Considering his small innings total, the number of out of zone plays he’s made (25) is also well above average, just not elite.
I just generally mistrust defensive metrics, no matter what the sample size is. DRS and UZR rate the same player differently far too often and season to season defense often shifts substantially. Don’t get me wrong, they are still useful, but the eye test is definitely important with defense still.
By eye test I would say the best defenders for the Dbacks are Ahmed, Pollock, Lamb, and Goldschmidt with Peralta and Inciarte both above average as well. Though I haven’t watched a ton of games(no cable).
No question. It still belongs in the conversation about player value, so even converting the eye test into a runs metric helps. But there are things we don’t see, like a player’s very first step, whether they started moving before contact… it’s kind of like wins for starting pitchers. More value than none, because we do want starters to be efficient with big leads, and reward them if they can really dig down when they have to.
It also doesn’t hurt when the numbers confirm the eye test… more confidence than when they don’t match. Neither is very good on its own. On TV, we miss first step and positioning; and even if you’re at the game, chances are you’re focused on the ball, and you don’t get the benefit of replay. Anyway, Statcast can help, eventually.
I’ve never seen anything like what Ahmed does. Acceleration and body control off the charts. So efficient with every part of his body.
This is wonderful. The batted-ball-velocity data is finally shifting the BABIP discussion into territory where it is helpful. For way too long folks who really didn’t understand it have been lazily using a BABIP=luck kind of analysis. It’s so much more interesting than that, thank God.
As for Lamb, let’s hope the regime really commits to him. Heyman (so take it FWIW) is reporting that in the offseason the team is going to be looking for a “bat to slot behind Goldschmidt.” Unless this bat plays 2B, I’m quite scared about what this might mean for guys like Lamb and Peralta, whose production has been super and are on the rise.
I agree, batted ball seems to flip BABIP on its ear. We should have been much more attuned to strikeout rate in combination with BABIP.
There’s more here — we’ve known from Trackman data for a long time that the highest hit rate actually comes from those weak fly ball flares that fall beyond the infield. Maybe Tomas is getting a benefit there. It’s a big part of what makes Inciarte helpful. And if we build batted ball velocity data into a new “Expected BABIP” solution, weak fly balls will have to be a part of that.
I can’t wait until this gets more automated. I had to count all of the hits by hand for the graphs above. Savant has averages, but that just doesn’t work as well — the difference between 30 and 80 mph is meaningless compared to the difference between 85 and 95 or 95 and 105. We need something more nuanced. For now, 4 months of D-backs data will have to do?
Lamb doesn’t seem to design his approach around home runs, so that total may never rise to a job-assuring total. I still think he’ll force their hand by the time the season is done.
You’re not wrong about second base… and yet Drury is worth the chance. So where? It’s almost like they could use a left-handed thumper behind the plate…
We’re back to being pretty consistent all over the field, but the standard is higher. Pitching staff included. Any upgrade needs to be a well above average player (so, kudos for going after Chapman, even?).
Wow, that you did all that by hand is tremendous. Thanks for that.
Yes, I think that is the logic, or should be the logic, behind a play for Chapman or someone similar. Solidifying the back end of the pen is not a bad idea and could be worth a couple marginal wins.
And I agree that Drury deserves a chance. Who do you have in mind at catcher? Castillo has surely done nothing to suggest that he can’t at least be part of a nice combo back there. Maybe making a play for Dioner Navarro, a switch hitter, makes sense? Then you’d feel quite good about catcher, I’d think.
[…] But if you’re reading this, you probably saw my case last week for how Jake Lamb‘s unusual collection of very hard hit balls warranted his high BABIP, even though his average batted ball speed was not […]
[…] through Baseball Savant. Comparing that breakdown to the team results we got in delving into Lamb’s BABIP success about a month ago, it’s remarkable that although just 6.4% of D-backs’ batted balls had […]
[…] is both something he can control, and something that makes a tremendous difference. That’s a big part of what makes Lamb tick; driving the ball was also the driving force behind Peralta’s surge around July and August. […]
[…] Lamb is doing is hitting the ball hard particularly often, as he did last year — it’s just that now, he’s taking walks at a slightly higher rate, and he’s […]