
I’ve been room-temperature about Rubby De La Rosa since he arrived in Arizona. Watching him in Los Angeles and Boston a time or two, he was the kind of pitcher that had the raw stuff but didn’t maximize it. At 23 or 24, that was understandable. Now, just a few days before De La Rosa turns 27, it remains a sort of mystery. Does he ever turn the corner and become the guy that has drawn considerable attention at times since bursting onto the scene in 2011? Should he win the fifth starter race, he’ll get one more crack at maximizing that potential that we’ve seen for several years.
As we’ve noted here, that make-or-break situation revolves around him being able to get lefties out. He was terrible with that chore last season. With massive platoon splits, De La Rosa was constantly victimized by opposite-handed hitters and never seemed to develop a strategy to combat them. Adding Mike Butcher may help, but the normal weapon to neutralize hitters with the platoon advantage, the changeup, has been long ineffective. Even dating back to his prospect days, it was De La Rosa’s distant third pitch and just hasn’t evolved into something that can effectively get outs. Among 78 qualified starters last year, De La Rosa owned the 17th-least effective change. Considering that many of the pitchers ranked below him barely threw the pitch at all and that it was a regular part of Rubby’s repertoire, the reality might actually be worse.
So I wanted to figure out just what happens to the changeup, why it’s so poor. To do so, I looked at all outcomes from the 533 changeups Rubby De La Rosa threw last season. Here are the numbers:
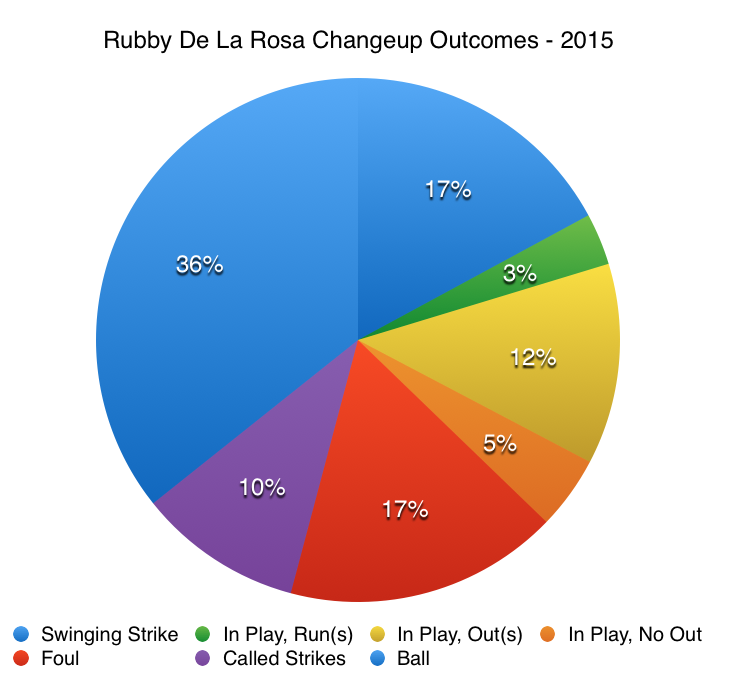
The graph is irrespective of counts and batters faced and all that. It’s just what happened when De La Rosa threw his changeup. 36% of them were balls. 17% of them were swung at and missed while 10% were called strikes. 20% were put into play, 12% of which were turned into outs.
The problem here is that we’re missing something very valuable: context. What are good rates here? If we’re assuming that these are, frankly, bad ones we’d surely like to know what kinds of outcomes a good changeup produces.
Lucky us, there’s someone in the Diamondbacks’ rotation who owned the 2nd-most effective changeup in baseball last season. That pitcher is Zack Greinke. Let’s do the same breakdown and see what kind of results Greinke’s change produced.
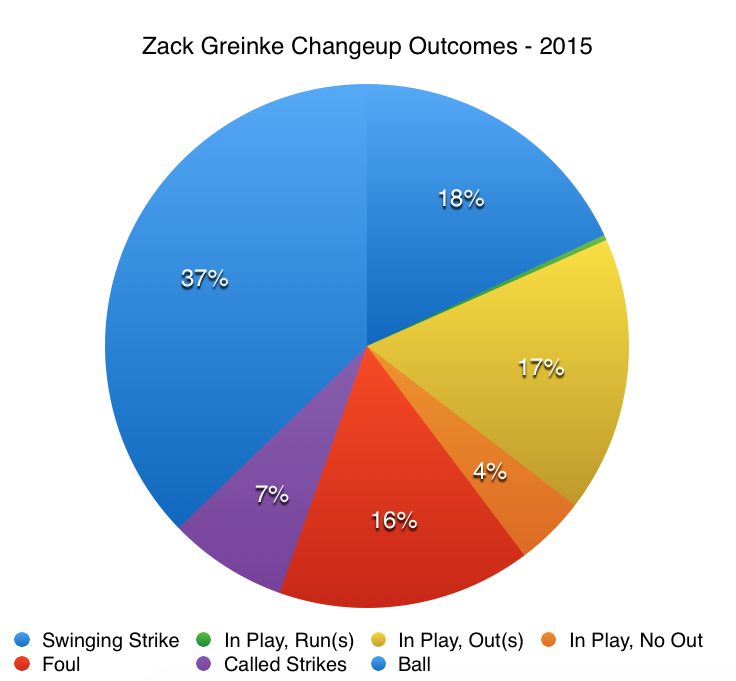
That’s not error – the two charts look very, very similar. 37% of Greinke’s changeups were called balls. 18% were swung at and missed while 7% were called strikes. 21% were put in play and 17% of those resulted in outs. The two guys even had similar foul ball rates. Maybe I’m alone here, but considering these changeups represent two polar opposites in terms of effectiveness, both had very, very similar outcomes.
But, there are two clear differences. That 5% gap in terms of changeups put into play that resulted in outs is a big deal, especially depending on when they were put into play and turned into outs. If it’s a pitch that Greinke can throw with the bases loaded and two outs, but De La Rosa doesn’t have the confidence to use it when in a jam, well, that would obviously change our understanding of their respective values. That fell outside the purview of this study, but even a glance of average exit velocities of their changeups (those put into play) showed eerily similar results (88mph for De La Rosa, 89mph for Greinke). This seems counterintuitive.
A look back at some changeup studies showed that a wide gap between fastball velocity and changeup velocity is beneficial. Maybe this is the ticket, maybe Greinke has the big gap and Rubby’s just not throwing off hitters’ timing effectively. De La Rosa’s fastball average 94mph and his changeup averaged 86mph for a 8mph difference. Greinke’s heaters averaged 91.7mph and his changeup averaged 88.2mph for a 3.5mph difference. Huh? It’s supposed to work the other way – the bigger the velocity gap, the bigger the advantage. But again, we come up empty.
Running out of options to figure out what’s happening here, it makes sense to look into movement. Let’s compare the two pitchers’ changeups in terms of horizontal and vertical movement (in inches) for 2015.
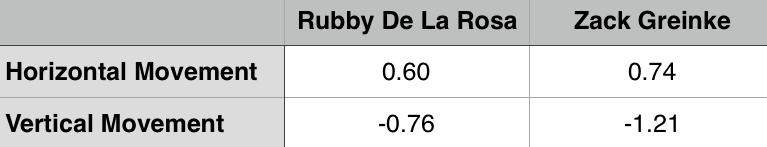
Greinke is getting just little more run on his changeup and and significantly more sink. The gap in vertical movement is nearly a half-inch, surely enough to miss barrels and even a few more bats altogether. From a movement standpoint, Greinke is getting more movement on the pitch than De La Rosa. More movement for Rubby would surely be a good thing.
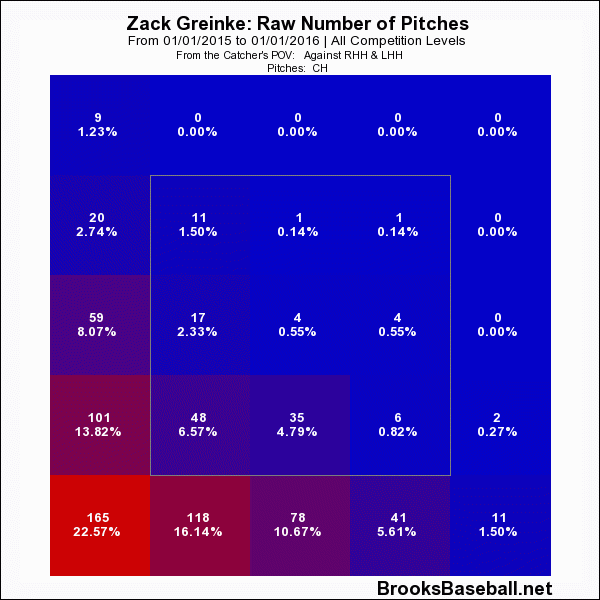
Of course, movement is only part of the story. Command is everything for a major league pitcher, and even though guys get away with mistakes every night of the week, big league hitters will punish mistakes regularly. Let’s look at where Greinke and De La Rosa are throwing these changeups.
First, Zack Greinke seems to like the pitch down and down some more to his arm side.
Rubby De La Rosa, while still locating the pitch to his arm side, seems to really struggle to keep the pitch down.
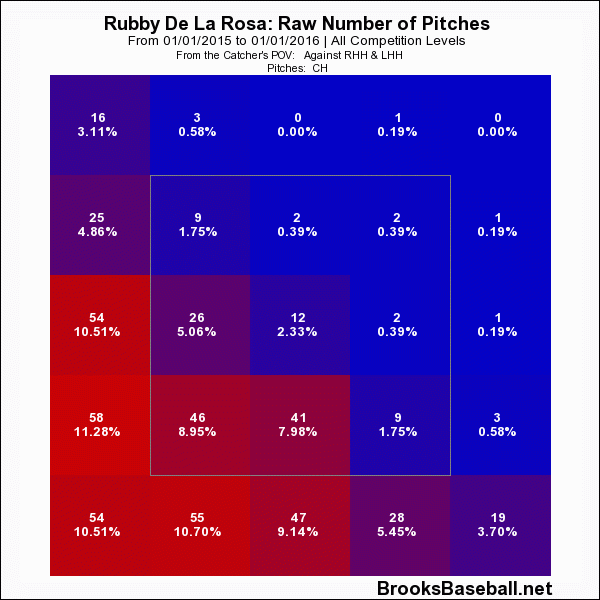
Yikes. De La Rosa struggles considerably compared to Greinke in terms of locating the pitch down in the zone. In fairness, being compared to Greinke is a tall task under almost any circumstance, but at least we see a clear separation. Rubby has left a higher rate of changeups in the zone and even many of those just out of the zone are elevated. When Greinke misses, he misses down and away to lefties. When De La Rosa misses, it’s kind of anyone’s guess where the pitch may end up. Assuming these locations aren’t strategic on Rubby’s part, command seems to be the biggest difference between the two pitchers.
It’s not realistic to expect Rubby De La Rosa to develop Zack Greinke’s command. Greinke is freakish with his ability to command the baseball with every pitch in his arsenal. That’s why he’s the highest-paid player in baseball. But for De La Rosa to take that leap forward, to get him away from his fastball/slider reputation, he’s going to need the changeup command to improve. He’s shown a willingness to throw it (he threw it 17.7% of the time while Greinke made it 18.4% of his total offerings), he’s just not getting the results desired. Maybe he scraps it and goes to a splitter, or, maybe he ultimately ends us a reliever that just doesn’t face many lefties. There are ton of reasons to give Rubby another shot, but if we want something to look for this spring, changeup command might be the biggest item to watch.
If you enjoyed this article, please consider sharing it!


3 Responses to Why Doesn’t Rubby’s Changeup Work?
Leave a Reply
@ryanpmorrison
 Best part of Peralta’s 108 mph fliner over the fence, IMHO: that he got that much leverage despite scooping it out… https://t.co/ivBrl76adF,
  RT @OutfieldGrass24: If you're bored of watching Patrick Corbin get dudes out, you can check out my latest for @TheAthleticAZ. https://t.co/k1DymgY7zO,
 - Of course, they may have overtaken the league lead for outs on the bases just now, also...
But in 2017, Arizona ha… https://t.co/38MBrr2D4b,
- Prior to the games today, there had only been 5 steals of 3rd this season (and no CS) in the National League. The… https://t.co/gVVL84vPQ5,
- RT @OutfieldGrass24: Patrick Corbin has a WPA of .318 and it's only the fifth inning.,
Powered by: Web Designers@outfieldgrass24
 RT @CardsNation247: Episode 30 of the Cardinals Nation 24/7 Podcast, Hosts @ToR_Ron75 & @JMRedwine welcome @buffa82 of @KSDKSports &… https://t.co/7dbIEzcahN,
  RT @TheAthleticMLB: From @enosarris: The next ‘Moneyball’ is already happening all around us — in the Wild West of player development: https://t.co/PUv1sg62nC,
  RT @joshuamckerrow: 1. Today I did the annual story on holiday decorations at the Governor's residence. I've done it every year, for ye… https://t.co/s7JnlHM1RO,
 - This Suns matchup comes at a good time for my hometown Blazers #RipCity https://t.co/fQ45wdfQUk,
 RT @ZHBuchanan: Our @Ken_Rosenthal spoke to Ken Kendrick about trading Paul Goldschmidt.
https://t.co/O5fHRlyBxD,
RT @ZHBuchanan: Our @Ken_Rosenthal spoke to Ken Kendrick about trading Paul Goldschmidt.
https://t.co/O5fHRlyBxD,
Powered by: Web Designers

Wanted to thank you guys for this blog. I’ve been following it every day for over a year and love your insights and analysis. I just hope Mike Butcher and/or someone in the Dbacks analytics department is paying attention as well!
I may be misunderstanding this, but it seem like if the charts above are from the Catcher’s POV as they are labeled, that Greinke is throwing his changeup down and to his ARM side instead of his GLOVE side as you’ve indicated. Am I looking at this wrong?
Oops! My error, will correct now. Thanks for catching that!
I agree w/ Zonie, aren’t most changeups that are thrown by RH pitchers down and in to RH hitters. The perception that inside pitches are coming a little faster than if thrown down the middle enhances the changeup thrown inside.