
Patience is a virtue, and for much of baseball’s history, a heavy reliance on batting average was probably misplaced; players have wildly different walk rates, and a walk is as good as a hit in terms of 1) putting a player on base, and 2) not recording an out. No one has ever said that walks are as good as hits overall, though, because they’re not. About a third of the time, a hit goes for more than one base, as a double (about 20%), a triple (about 2%), or, more importantly, a home run (about 12%). A walk goes for exactly one base; a hit goes for an average of 1.6. Now add the fact that with a walk, runners will advance, but only if forced to, and then only one base. A single with a man on second can scores a run; a walk banks that possibility for later.
What it all means in terms of scoring runs is that, on average last season, a hit was worth about .89 runs, as compared to an out (since an out makes it harder to score). A walk? Just .55 runs, relative to an out.* It’s not really a close call: hits are better, although the difference between an out and a walk is still pretty damned big. But we’re just talking about outcomes here, not an event like “take a pitch in this location” or “hit this ball this way.” With the exception of a no-doubt home run, there’s no kind of contact that guarantees a hit. You can hit the ball in play well, and lose, but you can also pass on a fastball outside in a full count that gets incorrectly called a strike. As always, the best process is probably to take the best opportunities. Hit it where it’s pitched, so to speak. But also, don’t try to hit it if you can’t.
Like the rest of us, baseball players are human. They have strengths, and weaknesses; and they aren’t perfect. Hitters have different approaches because those are approaches that they believe work, and because if you can’t be perfect in identifying the very best opportunity every time, you’ve got to err in one direction or the other.
So far this season, the hitters who have done especially well have been the hitters who err away from walks. These are guys that swing at those borderline pitches with two strikes. It’s paid dividends, and there’s a reason for that — but we’ll get back there. Right now, though, see what I’m talking about. First, here are the pre-season Steamer projections of the 12 position players currently on the roster.
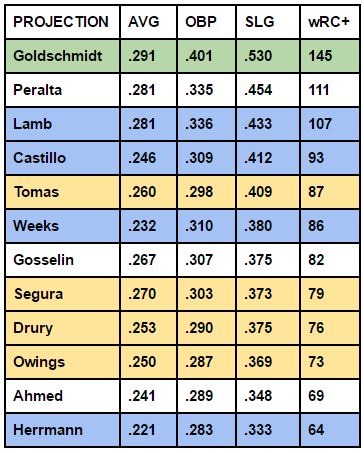
I used the difference between AVG and OBP as a kind of quick and dirty idea of walk rate (and a thing like a hit by pitch is something we probably want counted anyway). There were a few gaps, but essentially: yellow for “far below league average walk rate,” white the next tier up, cornflower blue for the guys near league average, and green for Goldy, who really does belong in his own category.
As it happens, the more walk-oriented guys tended to be well thought of here. For what it’s worth, Peralta was on the high end of the white tier, as well.
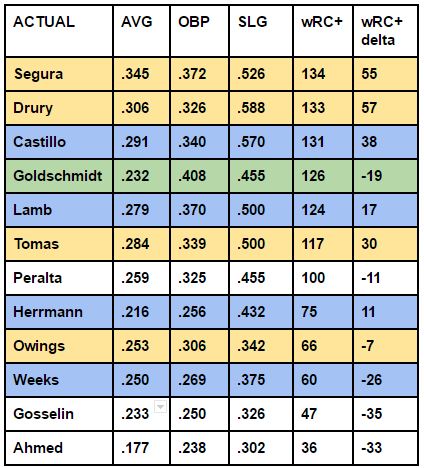 To date, though, the success of the roster has kind of been tipped on its head. The second table has the D-backs’ actual wRC+ numbers up through Thursday night’s game. Still sorted according to wRC+, the yellow guys have tended to move up, the blue guys have tended to move down. In truth, most of these guys have beaten their projections; I included the difference in wRC+ between the projections above and these actual numbers to date in the last column here, and the pluses outweigh the minuses overall.
Things shifted in favor of the free swingers, and it’s hard to miss that two of the freer swingers — Jean Segura and Brandon Drury — are also the hitters who have greatly outperformed projections. You couldn’t be blamed if you extrapolated from that. Sure, Castillo is the next-best improvement, but we have reasons to think his projection would be low. On the other extreme, Paul Goldschmidt was a candidate to outperform his projection, it seemed, but a giant gap between his AVG and OBP (.110 in projections, .176 in reality) also looks pretty suspect.
Whether there’s a cause to it or coincidence, it does look like the less patient hitters are being rewarded, while Goldy has born the brunt of some criticism, due to that .232 batting average. But it’s not the case that changes in hitters’ aggressiveness has changed their fortunes this year, at least not in the cases other than Goldy’s. Here are the changes in each of the hitters’ actual swing rates. The four guys who have been swinging more? They’re all doing worse.
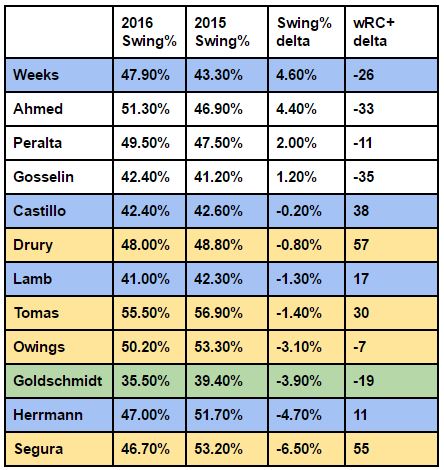 Hm. When you look at it that way, Goldy really does look like the exception, not part of a larger trend. And as Jeff explored Wednesday, he’s making contact at the same rate — it’s just that we can probably explain Goldy’s downturn in batting average by the type of contact he’s making. Something is going on there — a 35.5% swing rate is one of the lowest in the league, and exactly 10 percentage points lower than the 45.5% league average this year (which is also uncharacteristically low, for what it’s worth). But that doesn’t necessarily explain the downturn in his offensive output.
It’s not like walks have actually hurt anyone, and other than the Goldy extreme, that’s borne out in the numbers. Walks are good. Avoiding outs is great, being on base better. If a team had 9 guys in the lineup who each walked half the time (and never got hits), they’d score almost exactly 9 runs per game, nearly double what the D-backs are doing. That’s ridiculous.
But here’s the thing: the more lumpy the production in the form of hits and walks, the more runs a team actually scores. If you could have all of your hits and walks in one inning, you would take that in a heartbeat — as the D-backs have seen from their opponents time and time again this year. And nothing makes that hit/walk production lumpier than extra base hits.
If you’re looking for an explanation for why Jean Segura, Brandon Drury, and Welington Castillo are the guys who have outperformed their projections, there is another possible explanation that probably isn’t a coincidence: all three had little to no body of work in Arizona before this season, and Arizona makes hitters better. If you’re looking for a reason why the typically free-swinging guys are doing uncharacteristically well, that’s what it’s all about: the doubles, triples, and home runs. This year, their batting average has actually dropped, from .264 to .260 — and that’s with a boost in hitting from pitchers, too (without pitchers, the average last year was .272, this year .265). This season, the D-backs are busting the cover off the ball by picking up an extra base hit in 8.8% of plate appearances, way up from 7.8% in the very good offensive year last year. 8.8% would have made them 2nd or 3rd last season. It’s not just an increase in hitting overall, either; last season, the D-backs saw 33% of their hits go for extra bags, and this season that’s up to 38% of hits.
This is all something to monitor, but it doesn’t seem like an overall trend — it’s more that the guys who have moved toward the middle in terms of patience are doing very well, whereas the guys who have been at the extremes have done poorly. As always, it’s about what makes sense for each individual batter. And that’s how we’ll continue to look at it.
*If you want to understand how this works a bit better, check out the Linear Weights page in the FanGraphs library, curated by the excellent Neil Weinberg. It’s not about the run values of events, exactly, but as part of its explanation of linear weights, it lays out the run value process very clearly.
If you enjoyed this article, please consider sharing it!


3 Responses to Aggressiveness Not Affecting D-backs Hitters The Way You Might Think
Leave a Reply
@ryanpmorrison
 Congrats to @OutfieldGrass24 on a beautiful life, wedding and wife. He deserves all of it (they both do). And I cou… https://t.co/JzJtQ7TgdJ,
 - Best part of Peralta’s 108 mph fliner over the fence, IMHO: that he got that much leverage despite scooping it out… https://t.co/ivBrl76adF,
 RT @OutfieldGrass24: If you're bored of watching Patrick Corbin get dudes out, you can check out my latest for @TheAthleticAZ. https://t.co/k1DymgY7zO,
 - Of course, they may have overtaken the league lead for outs on the bases just now, also...
But in 2017, Arizona ha… https://t.co/38MBrr2D4b,
- Prior to the games today, there had only been 5 steals of 3rd this season (and no CS) in the National League. The… https://t.co/gVVL84vPQ5,
Powered by: Web Designers@outfieldgrass24
 RT @jaseidler: We’ve got three The Call-Up articles this morning at @baseballpro with at least two more coming tomorrow. Great wor… https://t.co/CgSqtS9noG,
  RT @TheRattleAZ: Opening Day 2020: The Rattle Goes Live! https://t.co/I0vwv2Eaae,
 - Hey, we're live! Click over and join us as we talk Opening Day and #Dbacks and plenty more! https://t.co/vYdwyu5H7g,
- About an hour out, come hang with us! https://t.co/J7yVZdneIA,
- This company is in my hometown and you may have noticed their gear around a ballpark near you. The pandemic has bee… https://t.co/FeRVd3zjGl,
Powered by: Web Designers

Did you back test this? And goldy appears to be trying something different.
[…] week, we looked at what seemed to be a team trend. Aggressive hitters like Jean Segura and Brandon Drury were taking the league by storm, and other […]
Thanks for the great info, it really is useful.