
We’ve used a lot of different ways to evaluate relief pitching on this site: We’ve tried to define “clutch” in terms of LOB%; We’ve looked at bullpens and one-run games; And we’ve also introduced the idea of using WPA/LI, to list a few. Our very own Ryan Morrison did excellent work at Beyond the Box Score to explain perhaps the most telling bullpen statistic, RE24. And this post picks up where he left off, while incorporating some new ideas.
Evaluating a reliever mostly comes down to a discussion about leverage. People want to know which relievers perform the best when the game is on the line, when the score is tight, and an inning, or two, of shutdown work is needed. That is where the two counting statistics, shutdowns and meltdowns, come into play. Using WPA (Win Probability Added), we can count how many times a reliever contributed positively (+.06 WPA) or negatively (- .06 WPA) to his team. Since win probability takes into account score context – a pitcher who allows two runs in a 9-1 game will not affect the win probability as much as one who allows two runs in a 2-1 game – we can see how often a reliever “does their job” in context-sensitive situations.
RE24 is useful because it takes score context out of the equation. It is based on run expectancy instead of win expectancy. Using a run expectancy table – which may differ based on the ballpark and year – we can find the average number of runs scored based on every base-out combination. For instance, with a runner on first and nobody out, the run expectancy would be 0.941, based on this table. By taking the difference between the run expectancy at the start of an event and the end of that event, we find the RE24 of that event. If a reliever, enters the game with a runner at first and nobody out, and pitches out of the inning without allowing a run, they would have a positive RE24 for that inning based on the situation they inherited.
As you can see, RE24 is a useful statistic, especially for relievers, because they are often entering the game in the middle of innings, in the middle of jams, and by using run expectancy, we can reward (or punish) them for their performance.
Again, the difference between using a statistic based on win probability versus run expectancy is the context of the game. And we know, as much as we want to make it into something, the idea of clutch doesn’t really exist. It does, I mean, of course there are certain situations when a player performs to a clutch standard, but in terms of evaluating players, over time, the best “clutch” players are usually the best players in general. If you are a reliever who can get big league batters out consistently, you will do so, no matter the score.
So it made me think that if we want to look at which relievers have been the best for the D-backs this season, why not take the idea of shutdowns and meltdowns, which are based on win probability, but calculate them using RE24 based on run expectancy?
Essentially, we can count how many times each Diamondback reliever had a positive impact on run expectancy versus a negative impact. We could then feel confident, independent of the score, which reliever has been most effective in preventing runs from scoring in high run-expected situations in the most number of games. By looking at RE24 from a counting statistic standpoint, it allows us to see the consistency of relievers to get out of jams rather than find ones who have higher overall totals based on successes/failures in extreme situations.
The tough part is deciding the threshold for a positive or negative run expectancy. But since RE24 is different than WPA in that we aren’t as worried about accounting for larger run situations as we are with higher win expectancy contributions, we can simply use a positive versus negative threshold.
How many games did reliever A have a positive or negative effect on run expectancy? That is what we are trying to answer. And remember, that in terms of a pitcher, RE24 is based on how many runs are “saved.”
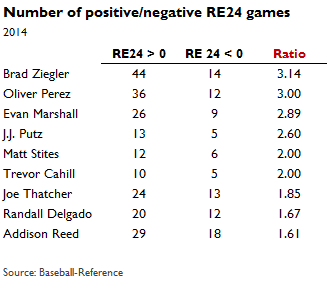
We can see from the table that Brad Ziegler has been the most effective and Addison Reed the least effective based on positive and negative RE24 games. Makes sense.
While Ziegler and Reed may be obvious, what we can learn from looking at these numbers is more about a pitcher like Joe Thatcher. He has 24 positive RE24 games and 13 negative RE24 games. If we used his shutdown/meltdown counts, because he doesn’t pitch in many high leverage situations, we would only find seven shutdowns and two meltdowns. Most of his appearances would be excluded based on the WPA threshold. With this, we can see a lot more about how he has pitched in each of his appearances, which ranks him towards the bottom of the list of D-backs relievers.
There are many ways to evaluate the performance of bullpen arms – we surely have tried our share on this site. Our goal is not to confuse you, showing you a different statistic each week, but to educate you on why different measures are meaningful for different reasons. If you want to understand which D-back relievers are best in “saving runs” based on run expectancy, which is score neutral, perhaps a counting statistic of RE24 is most useful.
If you enjoyed this article, please consider sharing it!


2 Responses to Using RE24 as a Counting Stat for D-backs Relievers
Leave a Reply
@ryanpmorrison
 Best part of Peralta’s 108 mph fliner over the fence, IMHO: that he got that much leverage despite scooping it out… https://t.co/ivBrl76adF,
  RT @OutfieldGrass24: If you're bored of watching Patrick Corbin get dudes out, you can check out my latest for @TheAthleticAZ. https://t.co/k1DymgY7zO,
 - Of course, they may have overtaken the league lead for outs on the bases just now, also...
But in 2017, Arizona ha… https://t.co/38MBrr2D4b,
- Prior to the games today, there had only been 5 steals of 3rd this season (and no CS) in the National League. The… https://t.co/gVVL84vPQ5,
- RT @OutfieldGrass24: Patrick Corbin has a WPA of .318 and it's only the fifth inning.,
Powered by: Web Designers@outfieldgrass24
- I didn't see Billy Hamilton as a true fit, but his signing with the Royals eliminates another CF option for the… https://t.co/I9t0LBCMsI,
- RT @OutfieldGrass24: Larry Fitzgerald has raised the bar. Not just for wide receivers, but for athletes uplifting their communities. He… https://t.co/L48kXpDKS1,
 RT @BobYoungTHI: The Q&A with @LarryFitzgerald from @sbordow is a terrific example of the content available. Check out the 40-percen… https://t.co/7d20QWHTqs,
 - THIS https://t.co/dZuhIFDy63,
- I don't know that I believe Robbie Ray is *not* available, but I firmly believe that the asking price would be very, very steep.,
Powered by: Web Designers

[…] regularly at this site. RE24 is dear to my heart, especially for relievers, and Jeffrey Bellone illustrated RE24 for us last week. We also use FIP and xFIP frequently, although I’m probably going to be moving to […]
[RANDLINE-text.txt]