
In 2011, the Diamondbacks won 94 games and won the NL West by eight games over the Giants. They got a bit lucky in doing so, going 28-16 in one-run games (12 games over .500 when the league average is, you guessed it, .500). Three years later, they finished at the bottom of the NL West pile with a stunningly disappointing 64-98 record. A .500 record in one-run games wouldn’t have saved the team (they finished 23-30 in such contests) but it might have kept them from drafting first this June. Still, we have to wonder just what caused the precipitous drop in the Diamondbacks’ stock in just three short years. In the span of just over two season of baseball, the franchise went from a postseason appearance as division champs and a 8-22 record in April and virtually no shot at the playoffs in 2014. Even in sports, that’s not an exceptionally long time.
For answers, I turned to the work of Matt Swartz of FanGraphs and MLB Trade Rumors and The Hardball Times. Baseball blogging is a vast sea of resources and in case you haven’t been keeping track, Matt’s been generating some really strong work. I ran into a recent piece of his at The Hardball Times where he explored the downfall of the Philadelphia Phillies. Immediately, I wanted to know how his examination of the Phillies might apply to the Diamondbacks and he was kind enough to assist me with some data points to get me started. So before I move on, a big thank you to Matt for being kind enough to help me, and I guess ‘us,’ out.
His thesis around the Phillies was built around some of his previous work around how teams choose to allocate their financial resources in an attempt to win baseball games. Essentially, Matt broke up players into two categories: Non-Market players and Auction-Market players. Rather than try to synthesize the definition, I’ll just site directly from Matt so as not to miss anything.
- Non-Market Players: players “who are either bound to their team by the reserve clause or eligible for arbitration.”
- Auction-Market Players: players “who are eligible for free agency or are at least eligible for auction by being professional amateurs from countries like Japan and Cuba.”
In short, Non-Market players are players with fewer than six seasons of MLB experience and are team-controlled in that they make the league minimum or are arbitration eligible. These are either guys that an organization has drafted or traded for who are still team-controlled. Auction-Market players are players who can be bid on by any team, commonly considered free agents. Applied to the Diamondbacks, Chris Owings and Addison Reed would be examples of Non-Market players as they are both still team-controlled (Owings at the league minimum, Reed through arbitration). Bronson Arroyo would be an example of a Auction-Market player as he was signed as a free agent. Hopefully that makes sense.
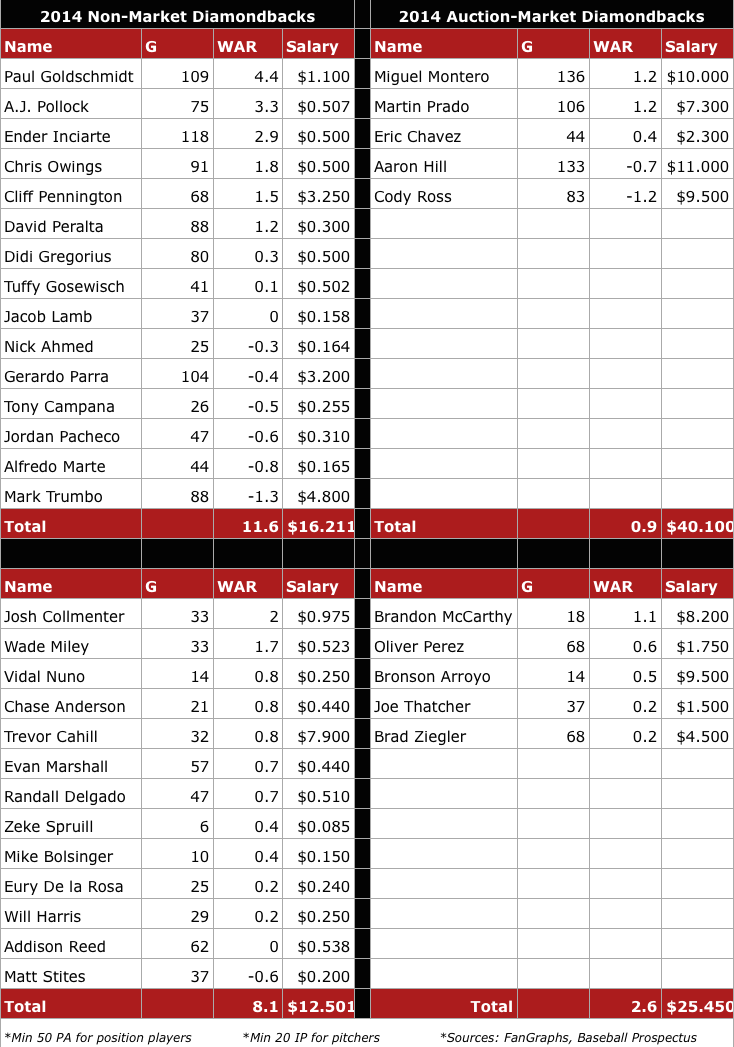
What Matt did with the Phillies, and what I’ll attempt to replicate here to a degree, is check and see just how the Diamondbacks have generated their production over the last three years. First, let’s take a look at how their Non-Market, team-controlled assets have performed as compared to the league average.
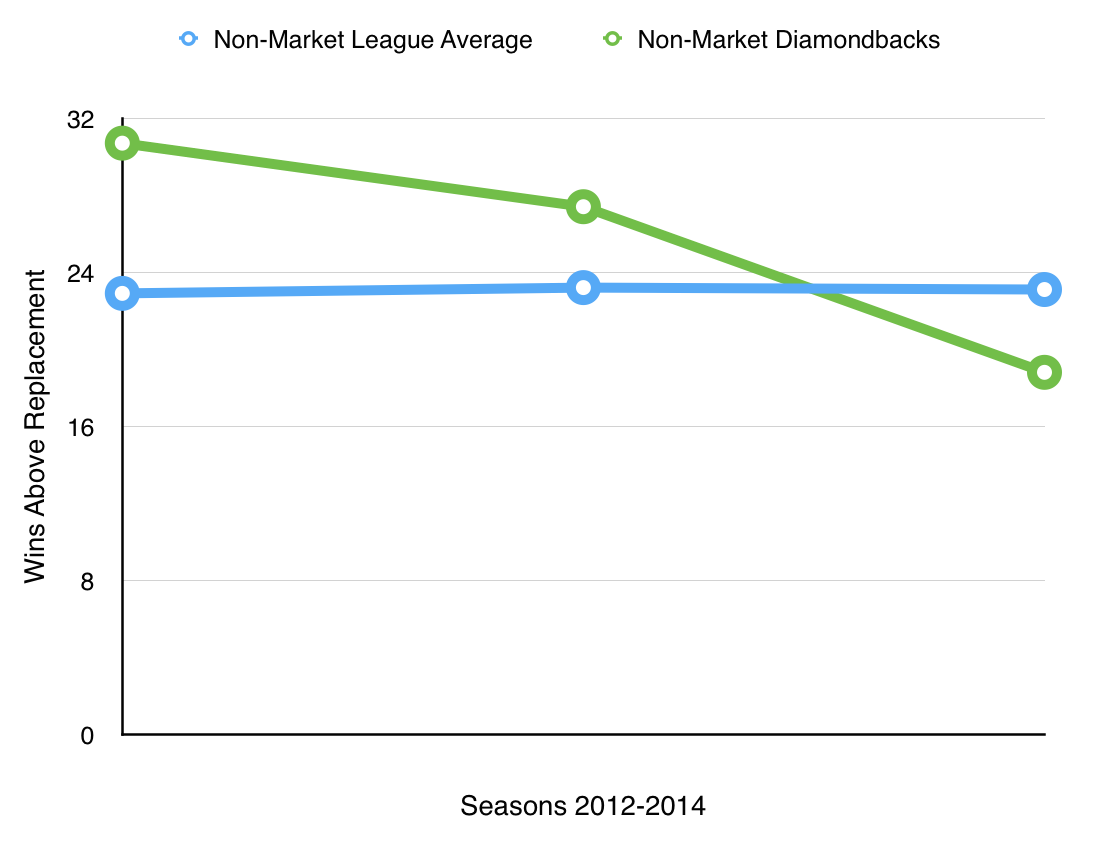
You’ll notice that the league average has held steady over the three-year span, but that the production by the Diamondbacks has waned significantly. You can attribute this to trading guys like Adam Eaton and, to a lesser extent, Tyler Skaggs and Trevor Bauer. Those types of moves haven’t helped. Of course, some other Non-Market players have disappointed, especially in 2014, with the likes of Gerardo Parra, Mark Trumbo and Addison Reed as obvious suspects. The team could have overcome this problem by supplementing with strong contributions from Auction-Market players, but, well, that’s not actually been the case.
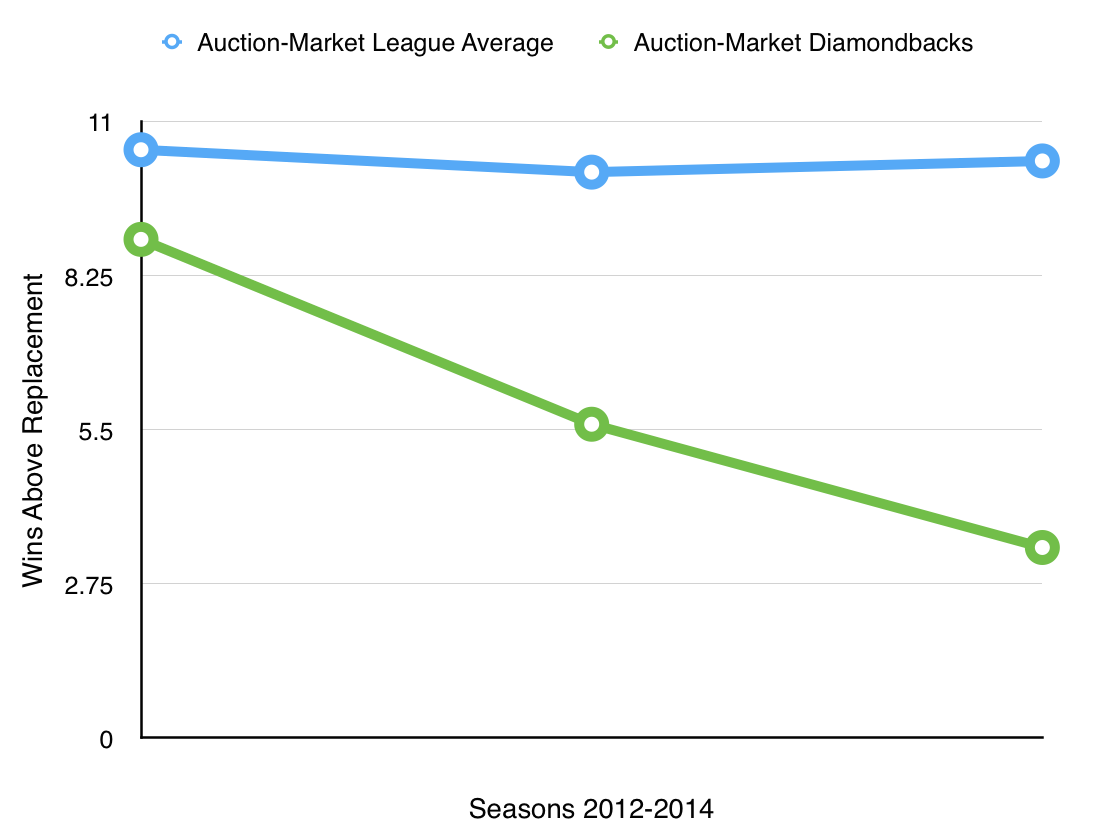
Here we see the real culprit for the team’s struggles. While payroll has increased, the benefits from the money invested have been more than simply underwhelming, they’ve been paralyzing. You’ll note again that the league average has held steady but that the production that the Diamondbacks have realized has been frustratingly low and trending firmly in the wrong direction. This is where the payroll increase has largely come from and, while the money spent has gone up, the production has gone down. One can easily see why Kevin Towers works elsewhere.
I decided to dig a little deeper and try to unveil just where this money was spent and what it netted in a return. So I did my best to break down the Diamondbacks’ rosters from 2012-2014 into Non-Market and Auction-Market players. In order to make things reasonable to research and digest, I set the threshold for players at 50 plate appearances and 20 innings pitched. Also, I did some serious personal calculations on salary numbers for players with minor league deals, such as prospects called up for part of a season or guys who played part of a season before either getting traded or designated for assignment. The total dollars for some of these smaller deals probably varies slightly, but there’s no easy way to calculate them without adding up service time and I often estimated this to the nearest half-month. Still, the final figures are relatively close. Also, by only calculating players who produced during a season, this ignores players who were hurt for an entire season and didn’t play, but I was just interested in what Arizona paid for the production it saw on the field, so not figuring players who missed the bulk of a season, or all of it in some cases, was an oversight. Still, take a look at how the organization spent it’s money during each of the last three years, then we’ll discuss. (Note: all wins represented are wins-above-replacement level)
2012
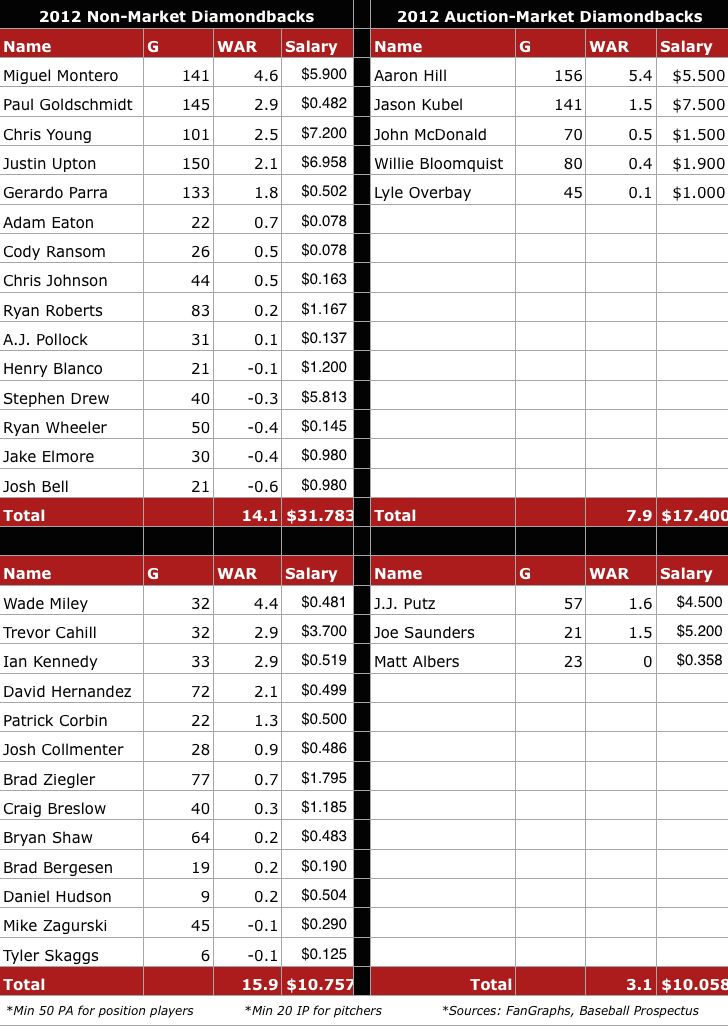
- Record: 81-81
- Team payroll: $74.1
- Non-Market cost per win: $1.4
- Auction-Market cost per win: $2.5
2013
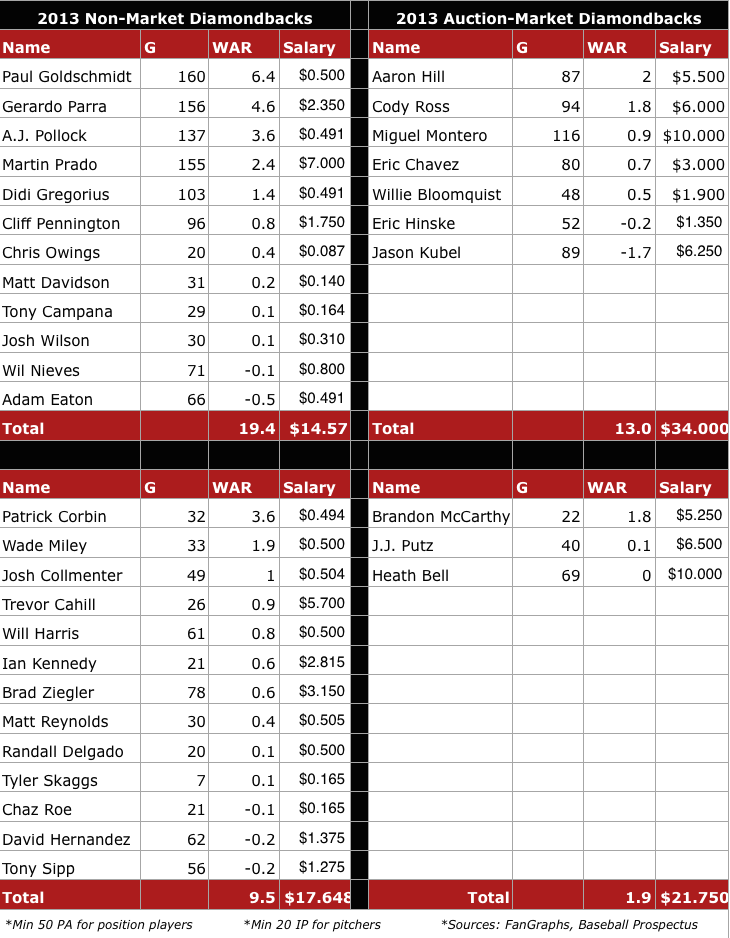
- Record: 81-81
- Team Payroll: $86.3
- Non-Market cost per win: $1.1
- Auction-Market cost per win: $3.7
2014
- Record: 64-98
- Team Payroll: $ 112.3
- Non-Market cost per win: $1.5
- Auction-Market cost per win: $18.7
In 2012, the Diamondbacks were shrewd and very efficient. Payroll was low-ish but the team was relevant, finishing .500 the year after they won the division. There was nothing wrong with the price they paid for each win above replacement. In 2013, it was largely the same story as a middle-of-the-road payroll team finished with a middle-of-the-road record. But things took a big turn for the worse when Kevin Towers and company went of a 2014 spending spree hoping to push the team over the 81-81 threshold. We were skeptical of what the results might be, but it ended far worse than anyone had envisioned. Injuries and inconsistency from position players and pitchers took their toll. The damage came largely from the drop in production from Auction-Market players. With guys like Aaron Hill, Miguel Montero, Martin Prado and Bronson Arroyo not getting any younger, a drop in production wasn’t unforeseen, yet the team had invested anyways. At their own peril, older players did what older players do: decline. The young players could’t pick up the pieces on their own and even if Paul Goldschmidt, A.J. Pollock, Chris Owings and Patrick Corbin had played all season, Arizona would have still finished well below the mark they were hoping for.
In retrospect, it’s the spending on Auction-Market players that’s put the organization in the position they’re currently in now. They did well to work out deals for guys like Goldschmidt, Josh Collmenter, Daniel Hudson and even Matt Reynolds but deals for more expensive, older assets have hamstrung their flexibility. These types of investments for a small-to-mid market team aren’t easily digestible when they turn south as they usually do at some point in time. Hill, Montero, Prado and Cody Ross, plus Bronson Arroyo and Eric Chavez, were all destined for a decline phase and the D-backs lumped players with similar ages together at a big cost. The result? All of their assets soured at the same time. The results were disastrous as we know.
Moving forward, the team will have to change their approach to signing free agents and extending players into their mid-30’s. The nucleus of the investment shouldn’t be entirely in the same age bracket as it just doesn’t diversify the team’s portfolio. By spacing these types of signings out and investing in individual players over time, rather than all at once, might help and avoiding deals that run through players’ 33-35 seasons would also be wise. In some cases these types of deals make sense, but sound investments for 35-year old players is the exception rather than the rule. Everyone breaks down eventually and by having a glut of expensive players in the same age bracket, the Diamondbacks got to see their investments break down simultaneously.
On the flip-side, the team has done well with young players and we’ll examine that specifically tomorrow. But for now, we’re left to digest what is hard to swallow and hope that with a new front office in place, the organization will throw less caution to the wind and instead take a more measured, less impulsive approach to buying players. There’s no question Arizona has buyer’s remorse from their last spending spree and it might be a while until we see more investment on high-profile free agents considering how badly they were burned last time around. Even with a TV deal on the way, a more pragmatic approach is surely needed.
*Another big shout-out to Matt Swartz for the Non-Market and Auction-Market data. You can follow him here on twitter (recommended).
If you enjoyed this article, please consider sharing it!


2 Responses to Big Investments Sunk the Diamondbacks
Leave a Reply
@ryanpmorrison
 Congrats to @OutfieldGrass24 on a beautiful life, wedding and wife. He deserves all of it (they both do). And I cou… https://t.co/JzJtQ7TgdJ,
 - Best part of Peralta’s 108 mph fliner over the fence, IMHO: that he got that much leverage despite scooping it out… https://t.co/ivBrl76adF,
 RT @OutfieldGrass24: If you're bored of watching Patrick Corbin get dudes out, you can check out my latest for @TheAthleticAZ. https://t.co/k1DymgY7zO,
 - Of course, they may have overtaken the league lead for outs on the bases just now, also...
But in 2017, Arizona ha… https://t.co/38MBrr2D4b,
- Prior to the games today, there had only been 5 steals of 3rd this season (and no CS) in the National League. The… https://t.co/gVVL84vPQ5,
Powered by: Web Designers@outfieldgrass24
 RT @cdgoldstein: I scheduled it late and forgot to promote it yesterday. Got a few questions in the queue but could use some more. C… https://t.co/38ul8wIsAD,
  RT @BillyBall: Great card and more importantly a really great and fun book by @dianagram. They have done a killer job on research… https://t.co/QgcHl7umwl,
  RT @baseballandthe2: The @Dbacks and @RaysBaseball were born 25 years ago on 3/9/95 when #MLB owners admitted the 2 new teams by a vote… https://t.co/1rzp6ax8wv,
 - #Dbacks' 2018 1st round pick Matt McLain hit .203/.276/.355 as a freshman at UCLA last year. This season? A tidy li… https://t.co/yM48j1ebrr,
- RT @OutfieldGrass24: Who's that under the radar player who you are banking on to break out this baseball season? Someone who's not regularly in the headlines?,
Powered by: Web Designers

Kennedy not following thru on his ’12 season mumber 1. Number 2 Huddy getting hurt, 3.Teheran instead of Delgado, 4.Parker for Cahill, 5.Trumbo for Skaggs, 6.Parra not turning into the first half parra off 7. overuse of bullpen not enough 7 inning guys. The article to intellectual for me, maybe that too.
8. bad luck on injuries.