
Few bright spots in the D-backs’ last-place 2014 season were brighter than Evan Marshall. Called up to pitch in his first game on May 6, 2015, Marshall left a path of destruction in his wake, pitching to a 2.74 ERA in 49.1 innings. His outstanding results looked completely earned; that ERA was backed by a 2.89 FIP, and while he gave up his fair share of home runs on fly balls (10% HR/FB), even that lended itself to the conclusion that Marshall wasn’t lucky, he was simply good.
Marshall pitched in the majors with an unusual profile. He had an elite strikeout percentage (25.7% K%, which worked out to a 9.85 K/9), but he also had an elite ground ball percentage of 60.1%, which trailed Brad Ziegler‘s GB% that year by just 3.7 percentage points. Unlike Ziegler, who appears to have to choose between strikeouts or an elite ground ball rate, Marshall managed both. Among 142 qualified relievers in 2014, Marshall was tenth in ground ball percentage, but also 44th in K/9. Only three other qualified relievers had a GB% of at least 55% and a K/9 of 9 or above.
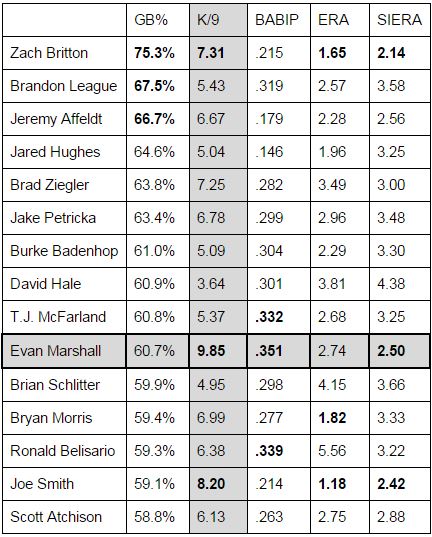 None of those fellows had a ground ball as high as Marshall’s, and no one with a similar or better GB% was within spitting distance; the highest K/9 of any reliever ahead of him in GB% was Zach Britton‘s 7.31 K/9, which was not much to write home about. Marshall was doing something unusual. And because that unusual combination was also a great combination, Marshall sported a SIERA (a very nuanced ERA estimator) of 2.50.
Our most nuanced ERA estimator is now Baseball Prospectus’s Deserved Run Average (DRA), which disagreed with SIERA violently. Marshall’s 3.89 DRA for his 2.74 ERA season in 2014 makes it look like his season benefited greatly by luck. That’s not exactly what happened, though. Even while Marshall was getting hitters to beat the ball into the ground in 2014, he was giving up more than his fair share of hits: 9.1 per 9 innings. 49.1 innings is a small sample, but not so small that Marshall’s .351 BABIP that season doesn’t stick out as really strange, and maybe even alarming. Of those same 142 qualified relievers, only three had a BABIP higher than Marshall’s .351.
Over the last few seasons, Marshall’s batted profile hasn’t changed very much. Using the breakdowns at mlbfarm.com, the ground ball trends were also true in 2013, and they continued to be true in 2015. Very little of that extra line drive residue in 2014 seems to have stuck to Marshall before or after that one season, which makes sense; line drive percentage is one of the least stable pitching statistics. That means that if the high line drive percentage was responsible for that unusually high BABIP, we’d have expected that to wear off a bit in other seasons.
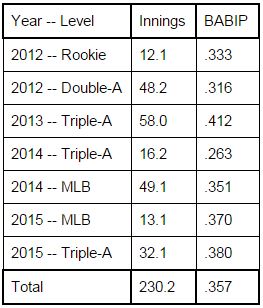 That’s not exactly what happened, though. Marshall has been plagued by high BABIPs throughout his career, especially in the last few seasons. It’s actually pretty strange. His 2013 season wasn’t spectacular by any means, but despite those high BABIPs (and that .412 in 2013 is no joke), Marshall didn’t really have a bad season until 2015. Why have his BABIPs been so high, and why did he succeed anyway until 2015?
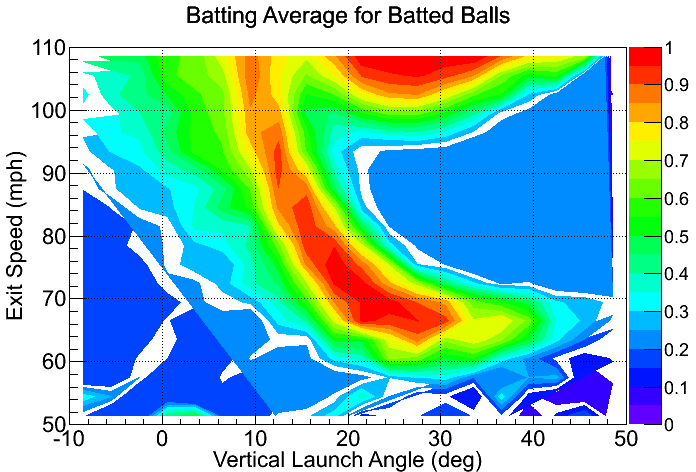
Home runs are a great kind of hit for a bunch of reasons, but one is: they always work. Hit the ball long and deep, and fielders don’t matter. Ground ball pitchers capitalize on a reduced number of fly balls that suppress home run totals. But ground balls also go for outs fairly often; unless you hit the ball very hard, balls that bounce before they reach the infield dirt are very likely to end up outs. There’s another kind of hit that also turns into hits very often, though: those Texas Leaguers, short fly balls that can’t be fielded by infielders, but fall on the outfield grass well short of the outfielders. That’s the crescent of red in this graph, from Dr. Alan Nathan last month at The Hardball Times.
Did Marshall just give up a whole bunch of those dying quails in his banner 2014 season? That’s what it looks like. We’re not talking about a ton of hits, but look at this spray chart from ESPN Stats & Information. The ground balls were almost all outs, and there were at best maybe 12 batted balls hit deep (the three HR are not counted in BABIP, anyway).
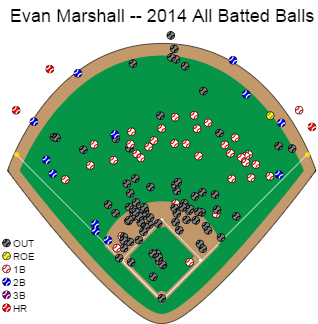
Even though the number of Marshall’s batted balls that turned into hits in 2014 was unusual, there isn’t much about this spray chart that looks strange. That band of singles in the outfield is the reddish swoop in the previous graph; if they were hit fairly hard (90 mph?) they didn’t have a high launch angle (but still around 10-15 degrees), and if they weren’t hit as hard, they were hit higher (maybe the 70 mph ones had that 25 degree launch angle).
The reason why any of this would matter would be what it tells us about Marshall’s likely 2016 performance. Can he recapture that strikeouts-and-ground-balls dominance that made him such an outstanding reliever in 2014? Acknowledging that we have a lot fewer tools at our disposal in looking at minor league performance as compared to the majors, Marshall’s 13.1 innings in 2015 can still give us some clues as to what happened last year.
The biggest thing: as with several other pitchers on the staff, Marshall’s sinker percentage went up quite a bit in 2015; he threw sinkers just 33% of the time in 2014, but that rose to 46.1% of pitches in that limited 2015 window. Since we know several other pitchers’ sinker percentage went up in 2015, we can probably say with some confidence that this was not necessarily Marshall’s idea. What’s more, as we explored recently, when RHPs throw sinkers to lefty hitters, the results can be really bad. Count Marshall among those pitchers; 61.25% of his pitches to lefties in 2015 were sinkers, and lefties hit .471 and slugged .941 off of the pitch. That’s almost unbelievably bad, and it almost completely accounts for Marshall’s struggles; the sinker was merely decent against RHH last year (they hit .313), but every other pitch did well against batters on both sides of the plate. Throwing sinkers to lefties was a bad idea.
Marshall didn’t have much success throwing the sinker to lefties in 2014, either — a .387 average and a .548 slugging mark — but nowhere near as bad as in that limited 2015 sample, and he also threw it to lefties less often (still 50.66%, but less than the 61.25% in 2015). We might have some confidence that that’s the kind of thing that can be changed, for the better. Marshall’s sinker is more of a true sinker; in 2014 it slid right off the plate, with much more horizontal movement (-8.72″) than vertical movement (2.66). In 2015 it was more of a “rider” with less “sink” (more “rise”), but it still had more horizontal movement (-8.11″) than vertical movement (5.34″).
Overall, lefties completely punished Marshall in the majors (.385/.407/.692), but that didn’t really carry over to the minors; in Triple-A after he was sent down last season, lefties’ slash line was a lot less troublesome (.270/.289/.378). That’s still pretty damned good, and righties walked a lot against Marshall in Triple-A last year (almost 10% of plate appearances), righties’ hitting (.300) and slugging (.367) were similar to those of lefties.
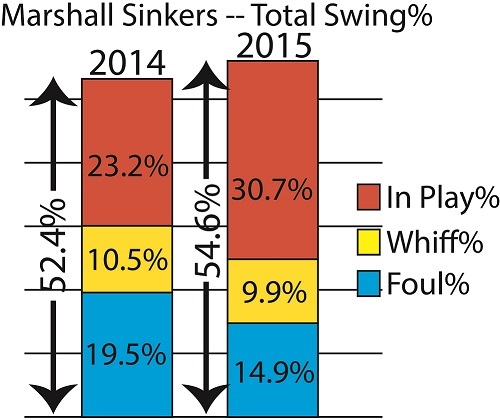 Hitters put a truly astonishing number of Marshall’s sinkers in play in that limited 13.1 inning MLB stint last year — more than 30% of them. He got a ton of ground balls with the pitch still, but it came with that price — and 12 of the 101 sinkers he threw were turned into line drives. It’s probably safe to conclude that Marshall shouldn’t be throwing so many sinkers to lefties — but as a starting point, the D-backs might try de-emphasizing Marshall’s sinker in general.
The projections have quickly fallen out of love with Marshall — ZiPS expects a 3.84 ERA from him in 2016, and Steamer is projecting a not-particularly-great 3.74 ERA, with a barely above replacement contribution this season. I wouldn’t expect Baseball Prospectus’s PECOTA to do much to help, either, considering that DRA was down on Marshall’s great 2014. Still, it wasn’t that long ago that Marshall was probably the second-best reliever in the D-backs’ bullpen. In the spring, the D-backs will give Marshall a chance to show that he’s back, and fully recovered from the skull fracture that ended his 2015 season with Reno. When we’re evaluating him, let’s just make sure to remember that all of those dying quails are a byproduct of what Marshall does to succeed — and while they still count as hits, a cluster of those (flock?) aren’t necessarily a reason to get down on him in general.
If you enjoyed this article, please consider sharing it!


3 Responses to Remembering Not to Forget Evan Marshall
Leave a Reply
@ryanpmorrison
 Best part of Peralta’s 108 mph fliner over the fence, IMHO: that he got that much leverage despite scooping it out… https://t.co/ivBrl76adF,
  RT @OutfieldGrass24: If you're bored of watching Patrick Corbin get dudes out, you can check out my latest for @TheAthleticAZ. https://t.co/k1DymgY7zO,
 - Of course, they may have overtaken the league lead for outs on the bases just now, also...
But in 2017, Arizona ha… https://t.co/38MBrr2D4b,
- Prior to the games today, there had only been 5 steals of 3rd this season (and no CS) in the National League. The… https://t.co/gVVL84vPQ5,
- RT @OutfieldGrass24: Patrick Corbin has a WPA of .318 and it's only the fifth inning.,
Powered by: Web Designers@outfieldgrass24
 RT @RoofNPanelsOpen: Since Miguel Montero was traded, the D-backs have struggled to find a solution behind the dish. That, however, seem… https://t.co/VoHweGVraM,
  RT @DSzymborski: How good has Ketel Marte been? He's on pace for 40 homers, but if you turned all 20 of his homers into singles, he'… https://t.co/yyfVvuO470,
 - Excellent work from Joshua on the #Dbacks catching transformation. It’s been stark to say the least. https://t.co/EuGtMBhhe5,
 RT @JesseNFriedman: @OutfieldGrass24 called this episode "meaty," and I have to agree. Check it out. We'd love to hear what you think. https://t.co/1E9IlcSpzG,
 - This thread is so fun https://t.co/XOTwX2E6Nh,
Powered by: Web Designers

I love that angle versus exit speed graph! Can we see a spray chart overlaid with all of the balls hitters hit off of Marshall? This would help us assess whether he did indeed give up a lot of bloop singles.
Sadly — that data is not public. Dr. Nathan built that graph out of HITf/x data, which has been around since 2007 (just like PITCHf/x), but which teams have kept to themselves (unlike PITCHf/x). Dr. Nathan is a rock star.
If we had had a bigger 2015 sample, we could have done something — the public data this last year included *some* exit velocity data, and even though the launch angle for those hits is not public, the distance to where the ball was fielded is, sometimes. As it is, we only have exit velocity data for 5 of the 13 singles that Marshall gave up in 2015. Of those 5, only 2 have a recorded distance in the public data. For what it’s worth, they both seem like bloop singles — 77 mph and 266 ft (Posey singles to Trumbo, 4/8/15), and 94 mph and 200 ft (CarGo to Inciarte, 4/27/15).
Hope the D-backs look into it with their access, though — MLBAM provides that data to every team.
[…] warned you over the winter not to forget Evan Marshall, and he reemerged in spring training, holding Cactus League hitters to a .205 batting […]