
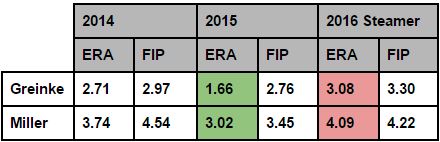
Zack Greinke has a great track record — in each of the last eight seasons, he’s made at least 28 starts, pitching as an ace or close to it in every one. Last year, though, the results were astonishing. In 32 starts, he managed 222.2 innings, an average of just under 7 per start which was the third-highest rate of all qualified starters. His best-in-the-majors 1.66 ERA sparkled. And he was an absolute metronome — of those 32 starts, 30 of them were quality starts, meaning he pitched at least 6 innings while yielding 3 or fewer earned runs. Only six other pitchers had as many as 25 quality starts last year.
On the surface, though, some of Greinke’s 2015 success looks improbable. By fWAR — in which Greinke ranked just 7th in baseball — one must travel all the way down the list to Johnny Cueto at 19th to find a strikeout rate lower than Greinke’s 8.08 K/9, which made strikeouts a strength for him, but not the reason he truly dominated. Few pitchers seem to be able to BABIPs substantially below league average (typically right around .300), and Greinke’s .229 BABIP made him look very lucky. Just one qualified pitcher had a BABIP lower than that (Toronto’s Marco Estrada), and even Jake Arrieta — who had an ERA almost as great as Greinke’s — managed a BABIP no lower than .246. Greinke saw very few of balls hit in play become hits, in comparison to his peers.
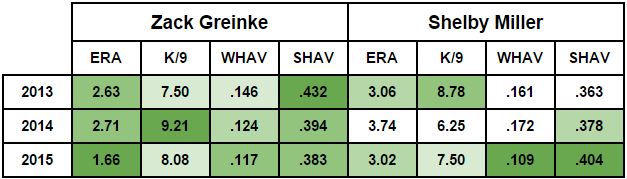
In that respect, Greinke was similar to the D-backs’ other big pitching acquisition this winter, who also had an unexpectedly low ERA in 2015. From a look at Shelby Miller‘s 2015 a couple of months ago, this table puts it into relief:
Both Greinke and Miller outperformed their Fielding-Independent Pitching marks last season, and as discussed in that December piece, there are only so many kinds of reasons for that. Per ESPN Stats & Info, Miller’s “Well Hit Average” plummeted from average-ish marks in the previous two seasons (.161 and .172) to a spectacular .109. That doesn’t mean that Miller can repeat the same ERA, but it does mean that he accomplished it at least partly through skill, and not only luck. Last week, Jeff gave us even more evidence that Miller’s batted ball results fueled his bottom line success.
Greinke’s .117 WHAV last year was among the game’s very best, and nearly as good as Miller’s. But recall, Miller sandwiched a mediocre 2014 with a 2013 he accomplished on the back of a good strikeout rate, and that 2015 when he was a contact manager.
Greinke’s 2015 almost had the strikeout rate of “Strikeout Miller,” while also having excellent batted ball results that were almost as good as “Contact Manager Miller.” Have one, and you might be a top of the rotation starter; have both, and you’re an ace.
Unlike Miller’s 2015 WHAV, though, Greinke’s did not come out of nowhere — it was only a modest improvement over his 2014, which was itself only a stone’s throw from his 2013. Once upon a time, Greinke was more of a strikeout pitcher, too — his 2012 WHAV was a much more normal looking .220. Both pitchers had outstanding batted ball results in 2015, and in both cases, that appears to be responsible for their ERAs being substantially below their FIP marks, which are based only on strikeouts, walks and home runs.
Look again at Greinke’s numbers above from 2014 and 2015, though. Greinke’s strikeout rate went down substantially, more than 1 K per 9. His WHAV got lower, which is great, but his Softly Hit Average shrunk somewhat, which isn’t. Based only on those statistics, it sure looks like Greinke probably would have done better in 2014 than in 2015; instead, his ERA dipped by over one run (nearly the difference between Miller’s 2015 ERA and that of Chase Anderson). So that’s the question: why? Because the more we find explanations elusive, the more of that success we might subscribe to luck.
The good news: there is something there, or some combination of things. Deserved Run Average at Baseball Prospectus, now our most nuanced ERA estimator, heaps a ton of the credit on Greinke: his 2.17 DRA says “okay, some luck” when compared to his 1.66 ERA, but it was also a very substantial improvement over his 3.43 DRA the year before. We have a few different things we can look at.
Batted Ball Velocity
Let’s start with a different look at the thing we think we know benefited Greinke: contact management. We know from our work here in a few different respects that batted ball exit velocity matters across the board, but that the difference between a 100+ mph batted ball and one that’s 95 mph is much larger than the difference between a 40 mph batted ball and one hit as hard as 85 mph. Every kind of ball in play that isn’t a pop up goes for a hit at least some of the time — but once you get into the high 90s and higher, it seems to be much, much more possible for a batted ball to get through an infield, into a gap or over a fence.
Here, then, are the percentages of batted balls for Greinke and Miller, along with some of last year’s starters for context. Note: one big caveat with this data is that it is not complete, and in an unrepresentative way. As far as we can tell, overall, the missing batted balls are likely to be good for pitchers, weakly hit balls. Here, they’re lumped in with the “gray” balls, up to 89 mph; green is 90-94 mph, yellow is 95-99 mph, orange is 100-104 mph, and red is 105+.
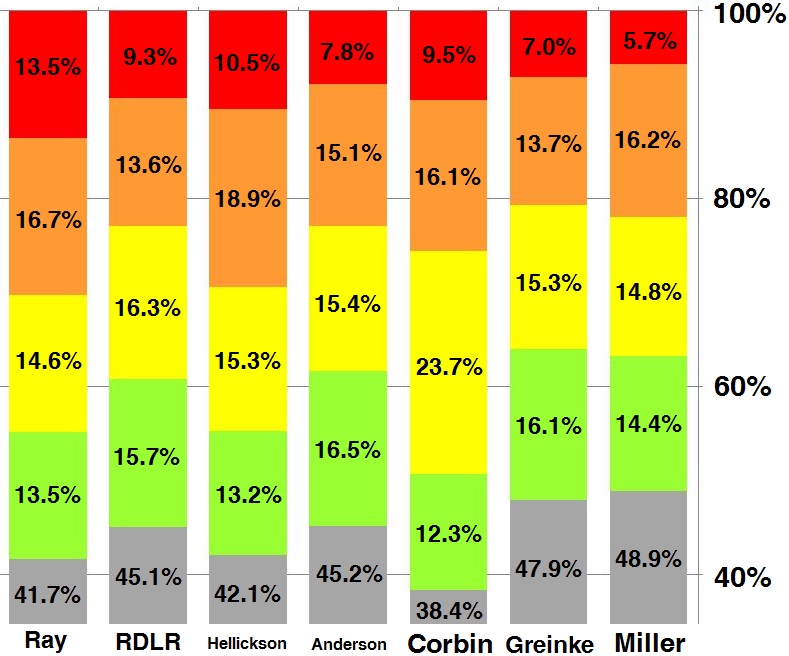
Probably the biggest thing here is that threshold between orange and yellow — the 100 mph line. Above that, there hasn’t seemed to be much difference; below it, things start to drop off very fast. In that respect, Greinke actually did have an advantage on Miller, and I’d go so far as to say this is enough to flip flop the slight advantage that Miller had in WHAV. It’s not, however, enough to explain the difference between Greinke’s 1.66 ERA last year and his ERAs from the prior two.
Situational Control
Season-long statistics generally make the general assumption that things even out over time — that the good things and bad things happen at more or less random times. We’ve come to expect that to be okay, as very few pitchers seem to get different results sometimes on purpose (if they could be better at particular times, they can usually be “just as better” the rest of the time, so why not be). That might be less true with relievers, but even then, relievers who succeed particularly well in some spots tend to get those chances because they’re put in those spots.
If pitcher wins have any value as a statistic (and I think they do), that’s why: maybe a pitcher is so good that we do want them to “cruise” when they can, knocking out more innings in the process. Pitch to the score? Not exactly. But recording strikeouts is hard, those outs take between one or two more pitches per out, on average. I think if there were some evidence that a pitcher was adjusting the throttle, it would show up with the difference in walk and strikeout rates depending on runners, first and foremost.
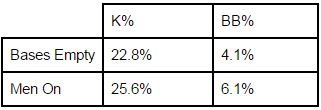
Greinke recorded strikeouts at a higher rate with runners on, and that does look like effort — it’s just that that came at some kind of smallish cost in terms of walks. That 25.6% K% rate with men on is quite a bit better than his 23.7% K% overall. It’s also higher than in the same situation in 2014, despite his higher strikeout rate that year — he had a 25.2% K% overall, but 26.1% with the bases empty, when they’re not as important, and 23.9% with runners.
So that’s a smallish but real advantage from one year to the next. Looking at more situations — bases empty, runner only on first, and runners in scoring position, each with zero, one and two outs — it definitely seems like Greinke throttled up and down based on the situation. We often use K% – BB% as a way to get a read on a pitcher; 10% would be mediocre, but even 15% would be pretty good.
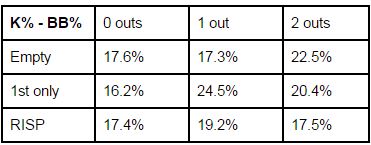
That looks like Greinke throttling up and down in terms of success, if moderately; mostly with respect to zero outs or more. Not very pronounced, but it’s there. We’re probably more interested, though, in whether Greinke changed his approach. And for that, let’s try adding K% and BB% together as a shorthand for: was Greinke pitching to contact?
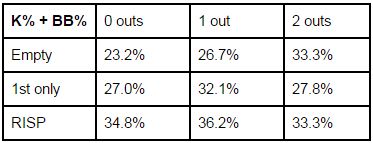
This should stand out a whole lot more. It looks like just about a third, or more than that, is about as high as Greinke can go. With the exception of 2 outs and bases empty (which we saw in the preceding chart led to a ton of strikeouts), as runners were on/advanced, Greinke seems to have put fate in his own hands, pitching to contact less. It’s a little like this: with very little to lose (2 outs, empty), Greinke went for the middle of the plate because why not, with good strikeout results. With not much to lose, he aimed for the corners, trying to generate weak contact. And if the stakes were higher, he went for those strikeouts a lot more, even at the price of a higher walk rate.
That approach worked. Greinke had an obscenely high 86.5% left on base percentage last season. He’s been in the stratosphere for a few years now — in between 78.8% and 80.8% the previous three years — but that 85%+ LOB% is one of those numbers that’s so extreme that it almost has to be the combination of tons of skill and tons of luck.
***
This was really just a first step, one in which I stay convinced that Greinke did assert some control over his excellent 2015 outcome. The DRA marks probably told us that in the first place, and yet for his whole time with the Dodgers, Greinke outperformed even DRA substantially, in every year. With some shreds of evidence that Greinke avoided hard contact and also outperformed chance through pitching to the situation, maybe we know that Greinke did do it. But there’s a whole lot more to do to disentangle how he did it. And for that… next time we’ll get to PITCHf/x and see what we see.
If you enjoyed this article, please consider sharing it!


2 Responses to How Much of Greinke’s Sparkling 2015 Was Luck?
Leave a Reply
@ryanpmorrison
 Best part of Peralta’s 108 mph fliner over the fence, IMHO: that he got that much leverage despite scooping it out… https://t.co/ivBrl76adF,
  RT @OutfieldGrass24: If you're bored of watching Patrick Corbin get dudes out, you can check out my latest for @TheAthleticAZ. https://t.co/k1DymgY7zO,
 - Of course, they may have overtaken the league lead for outs on the bases just now, also...
But in 2017, Arizona ha… https://t.co/38MBrr2D4b,
- Prior to the games today, there had only been 5 steals of 3rd this season (and no CS) in the National League. The… https://t.co/gVVL84vPQ5,
- RT @OutfieldGrass24: Patrick Corbin has a WPA of .318 and it's only the fifth inning.,
Powered by: Web Designers@outfieldgrass24
 RT @JCGonzalezOR: Special thanks to @HillsboroHops for hosting a LatinX community outreach and visioning session. This organization i… https://t.co/OxmEgwOpEh,
 - Old friend alert https://t.co/xwSHU0F8Hn,
- Every once in a while you get a beer that's just a little off... Usually happens to me at airports.,
- If Pollock doesn’t sign with a team that wears red uniforms I’m going to be really disappointed. Working theory: Se… https://t.co/zHn9DqzEiD,
- The work here by @Britt_Ghiroli is splendid https://t.co/c8tSq0vw3T,
Powered by: Web Designers

Having one of the best change-ups in MLB baseball can make you very lucky…
A lot of what these stats showed is that Greinke simply didn’t give hitters anything to hit when he had runners in scoring position. Hitters struck out more, walked more and when they did put the ball in play, they didn’t square up on it. Why? Because Greinke simply didn’t put the ball in the strike zone that much once runners were in scoring position.
Only the most disciplined hitters can continually lay off pitches with runners in scoring position. That desire to knock in the run overwhelms them. Joe Garagiola calls this “feed the hitters greed”.