
A new year provides an opportunity for reflection. I was doing a bit of that recently, thumbing through some old episodes of The Pool Shot while being delayed at the airport again. The experience was fun and while I’d like to think we were right more than we were wrong, the episodes help harken back to a time that the birds were chirping, the season was yet to begin, and there was still the soft scent of optimism in the air. We know what happened next and don’t really need to relive it. But there was one thing I was particularly interested in regarding the bullpen, particularly how the group would fare coming off a 2015 season in which there were some signs for hope. Those didn’t manifest themselves, necessarily, but I got to wondering just how bad the 2017 D-backs bullpen might be and how good the average reliever really is, or maybe, isn’t.
Establishing a baseline is paramount for any kind of analysis. After all, we have to know what we’re looking for. With that in mind, I set out to see how some basic statistics matched up with reliever quality. As Ryan has shared before, relievers are a particularly fickle bunch to value properly. ERA is terrible, FIP isn’t great, and WAR is just as bad (mostly because it either takes runs scored or fielding independent pitching into account, which is really the whole problem). As he’s found, RE24 is a better measure, determining whether a pitcher allowed more or denied fewer runs above average to score for any particular base-out state. If you want to learn more about RE24, check here, but know that we’ve chosen to review relievers through this lens for a reason and it’s one we have a lot of confidence in. With this in mind, RE24/IP is a useful, if not perfect, way of evaluating relievers on a rate basis. Over the last three years, here are the 10 best and worst qualified relievers by this measure. I’d say it matches our intuition pretty well.

You’re well aware that strikeouts are good, and as I explained last week when discussing which D-backs starters might find themselves in the bullpen next season, they’re particularly good for relievers. While there are surely other ways to get batters out, there’s no more sure way to get batters out than not allowing them to put the ball in play. Using RE24/IP as a mark of talent, here’s how RE24/IP and K/9 correlate.
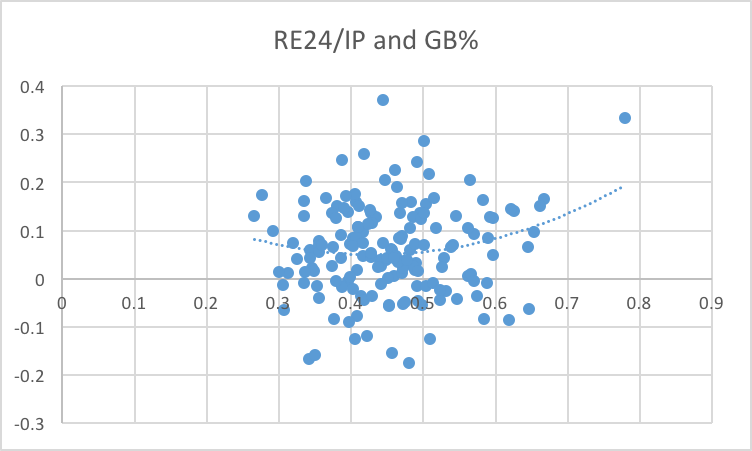
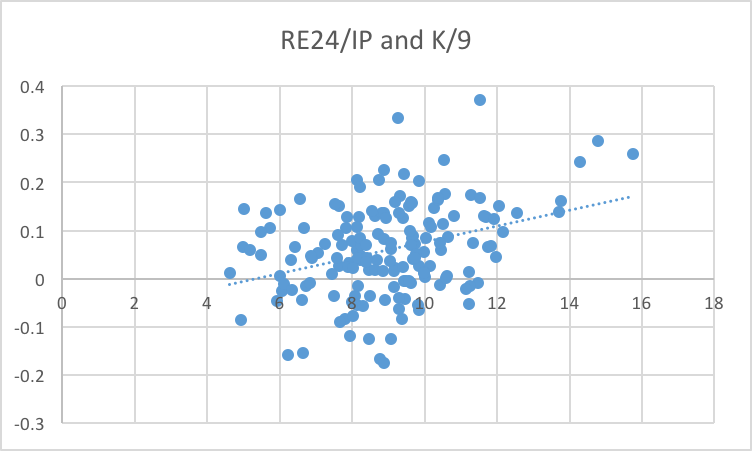 We can see that as K/9 increase (x-axis) that RE24/IP (y-axis) tends to go up. The correlation here is somewhat strong at .349, so there’s a statistical correlation though not an overwhelming one. That’s, again, because strikeouts aren’t the only way to get batters out. Some do it through controlling batted balls. Old friend Brad Ziegler checked in 11th in the chart above, just missing the cutoff, and has certainly found success in a different way. But things get a little fuzzy when looking at ground balls and fly balls. Here’s what we see with those two indicators, starting with grounders.
And flies…
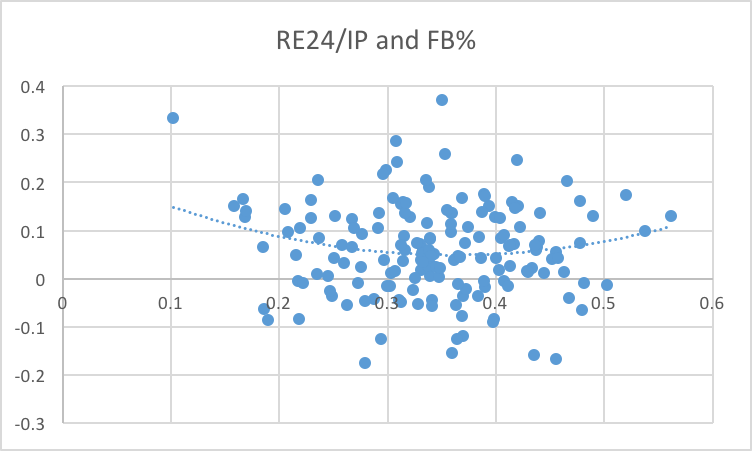
Take a close look and notice the polynomial trend lines as they tell us something important. The curves bend downward with their apexes pointing in the direction of being poor at controlling batted balls and, ultimately, being a poor reliever. The takeaway is something we’ve said many times before: you’ve either got to generate a a lot of grounders and very few fly balls, or lots of flies and very few ground balls. Where you don’t want to be is in the middle as the graphs above prove. More batted balls are hit on the ground every year than in the air (though the extent of this discrepancy is changing), but having a blend of the two that only slightly skews to grounders is bad place to be.
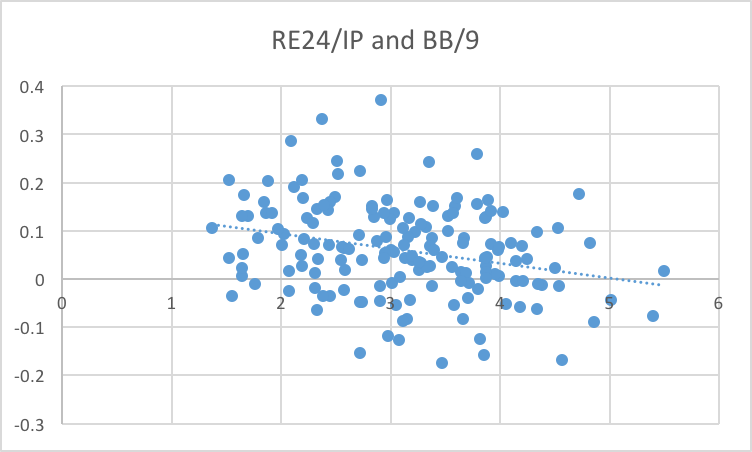
We know that two things are often quite bad for relievers, those being walks and homers. First, have look at walks and RE24/IP.
And home runs allowed…
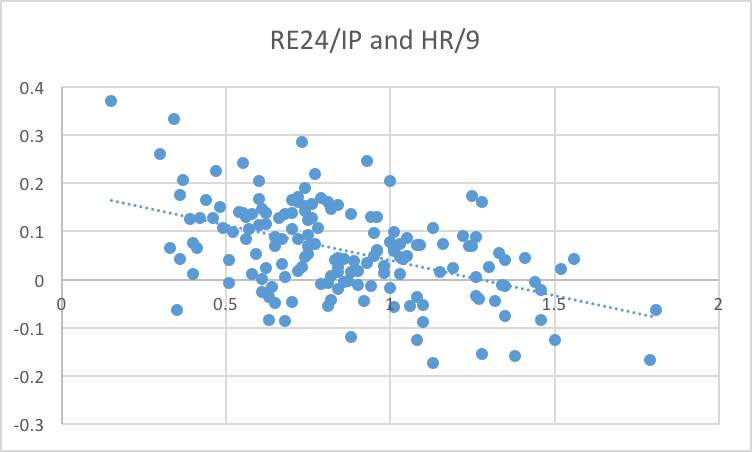
Homers are very bad and we know it. Some pitchers give up more of them than others and we know that, too. But homers happen to every pitcher and that’s just how it goes. Avoiding the guys who are homer-prone over a long length of time is a good thing. Walks are interesting in that they’re not, perhaps, as bad as one would assume. The correlation between RE24/IP and HR/9 is -.476 (the more homers you give up, the worse the performance, hence the negative number), but RE24/IP and BB/9 has just a -.277 correlation, making it significantly weaker. So walks are bad, but not certain death, and definitely not as bad as home runs.
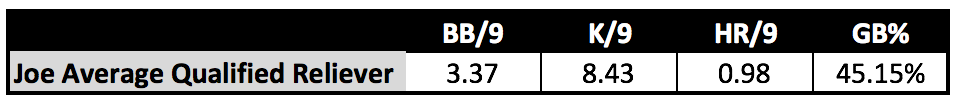
The sample of qualified relievers over the last three seasons is 163 pitchers deep. The average qualified reliever is better than the average reliever. Those that “qualify” do so because they’re good enough to keep eating up innings (or at least good enough not to get designated for assignment if they’re out of minor league options). Simply put, there’s a major survivorship bias here, but in this case, that’s okay because we want to know if how the D-backs’ bullpen options stack up against the average qualified reliever. Here’s the how the indicators above break down on average.
Now let’s compare these figures with the Steamer projections for the Diamondbacks’ bullpen candidates from the 40-man roster. Being “average” can’t be that hard, right? Well, I’ll let you decide for yourself.
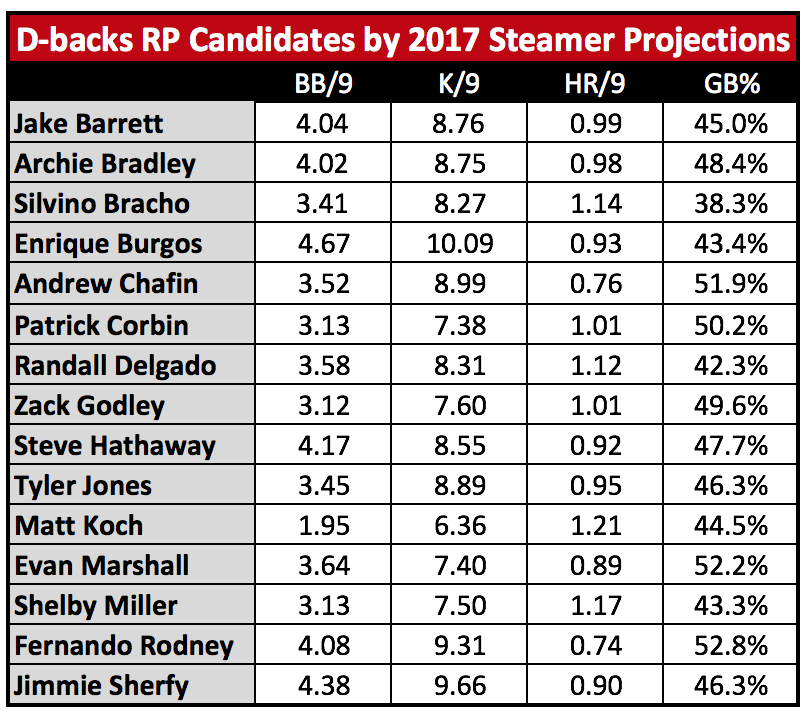
Included are the starters that I laid out as potential bullpen fits, though I settled on just Archie Bradley moving into that role. The starters’ numbers would likely change a bit in a relief-only role, but let’s just go with this for the time being. Without Zeigler in the fold, ground ball assets appear to be Andrew Chafin, Patrick Corbin, Zack Godley, Evan Marshall and Fernando Rodney. Silvino Bracho is the only potential fly ball asset (though he’s got plenty of other issues). Of this group, only Rodney adds a boon of strikeouts to the equation. Most pitchers are well below average in the walk category, but as we discussed before, they’re not the end of the world as long as you can avoid home runs and render those base runners useless with punch outs. Again, Rodney does this as do Andrew Chafin and Enrique Burgos. A lot of this crop has a chance to be average, or maybe even a touch better, but there are two things to be wary of here: most guys are walking a razor-thin line between being average-ish, and, how useful is a bullpen full of potentially average relievers? Over the last three seasons, the most average relievers by RE24/IP have been guys like Zach McAllister, Tony Sipp, and Robbie Ross, Jr. And this is “average” amongst qualifiers only, so the bar for all relievers is much lower.
There are plenty more questions to be answered here, such as how strikeouts and walks interact, how home runs are divided up among ground ball and fly ball pitchers, and more. But it’s pretty clear that the Diamondbacks have a bunch of guys that can be useful big league relievers. It’s unclear how many of them will be useful big league relievers because the lines separating being above average, average, and below average are ultra thin. Timing is everything and the uneven distribution of outcomes (aka “luck”) can skew ultimate results. Improved defense can help. Pitch framing can help. A new, smarter approach to pitching can help. But on talent alone, this group is far from overwhelming. It may be too presumptive to call them “bad,” however, as there’s still so much we don’t know. What we do know is that we’re unlikely to see much in the way of dominance, though some internal improvement is much needed. There might just be enough talent present to see some of that in 2017.
If you enjoyed this article, please consider sharing it!


3 Responses to Raising the Bar for Relievers
Leave a Reply
@ryanpmorrison
 Congrats to @OutfieldGrass24 on a beautiful life, wedding and wife. He deserves all of it (they both do). And I cou… https://t.co/JzJtQ7TgdJ,
 - Best part of Peralta’s 108 mph fliner over the fence, IMHO: that he got that much leverage despite scooping it out… https://t.co/ivBrl76adF,
 RT @OutfieldGrass24: If you're bored of watching Patrick Corbin get dudes out, you can check out my latest for @TheAthleticAZ. https://t.co/k1DymgY7zO,
 - Of course, they may have overtaken the league lead for outs on the bases just now, also...
But in 2017, Arizona ha… https://t.co/38MBrr2D4b,
- Prior to the games today, there had only been 5 steals of 3rd this season (and no CS) in the National League. The… https://t.co/gVVL84vPQ5,
Powered by: Web Designers@outfieldgrass24
 RT @ZHBuchanan: If you haven't filled out our Diamondbacks fan survey yet, there's still time. We want to hear from you!
https://t.co/ctzkNTbk5s,
RT @ZHBuchanan: If you haven't filled out our Diamondbacks fan survey yet, there's still time. We want to hear from you!
https://t.co/ctzkNTbk5s, - “Top US News: Tesla merch now available for purchase with Dogecoin”
The point at which I wish to formally withdraw… https://t.co/7k38A7nDCQ,
- Ya boi with the feature image https://t.co/g3SMJYmAQq,
- Nelson fell asleep waiting for Simcoe to get home from the groomer. I’m jealous, honestly. https://t.co/CO4FZtwhUJ,
- RT @OutfieldGrass24: Dynasty question: Daniel Espino, Emerson Hancock, and Quinn Priester. Gotta cut one. Who should it be?,
Powered by: Web Designers

Innaresting that Tyler Jones and Sherfy project as two of the most competent relievers on the roster. Another reason why I’d bet Jones sticks. Hope Sherfy looks better at the big league level than guys like Bracho and Burgos have…
It would interest me to know where Will Harris and Addison Reed fit on the “average reliever” scale. My guess is, quite a bit better than anything we have to offer. So what are their numbers?
Isn’t it difficult to compare projections for guys who traditionally are starting pitchers with those who were relievers? What’s the value of any of those p/9 stats when guys like Bourgos/Barrett/Bracha have never been starting pitchers and historically rarely pitch more than an inning at at time — both BB and K’s are going to be exaggerated on a p/9 basis, and especially compared to starting pitchers who more typically pitch 5/6/7 innings at per outing. Would a stat like per batters faced be more realistic?