
There are those times, in my journey to learn about baseball, that I’ve legitimately had my mind blown. Most of them occurred early on, when I learned that saves were made up by some guy in the late 60’s, RBI’s were mostly a function of guys getting on base in front of a hitter, and pitchers don’t have all that much control over what happens to a baseball once it’s put in play. But one happened just a few years back when the idea of pitch tunneling made it’s way in front of my eyes as part of a larger discussion on velocity. Here was an incredible question: how much do two distinct pitches from a pitcher look like one another to the batter? We can talk about the shape, break or velocity of individual pitches all we want, but what’s most important is how the pitches are perceived by the hitter.
Baseball Prospectus has been seeking to measure this, and a few weeks back rolled out their methodology as part of a week-long saga that served as the backdrop for this new frontier. Not long after, numbers from the 2016 season were added to their leaderboards and voila! we have data. Hats off to the Jeff Long, Jonathan Judge and Harry Pavlidis for bringing this to the forefront as it can have big consequences (just like we’ve seen with their work around pitch framing). If we were to know which pitches sequence together well and which don’t, that could help shape our understanding of which pitch combinations should be prioritized for each pitcher. And, it could enlighten us to which pairs of pitches should be avoided. This seems potentially helpful. Really helpful.
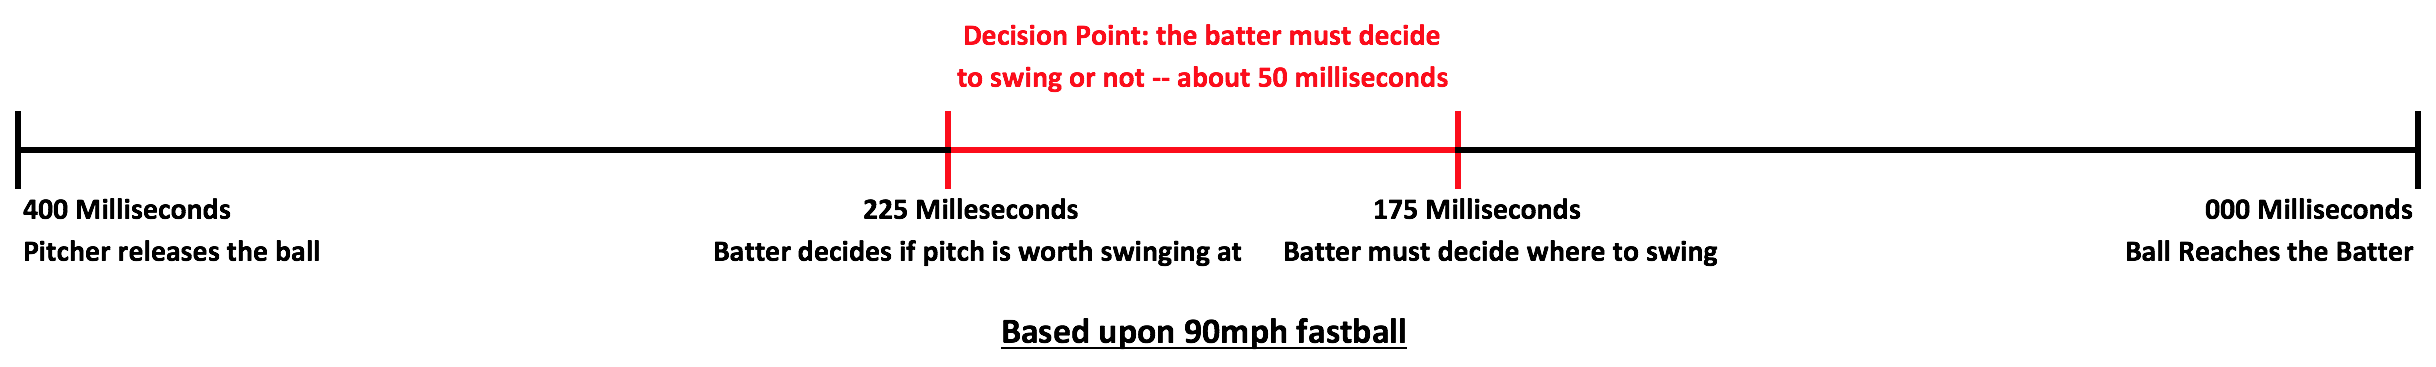
But before we get into that, we need to lay out some groundwork. As the BP crew shared, a hitter’s decision to swing at a pitch is both simple and complicated: it comes down to a decision. That jives with our intuition, but there’s something about that decision that makes it unique — it has to happen in a tremendously short amount of time. The hard-to-read chart below maps out this decision (click to enlarge) based upon a 90mph fastball. Only 400 milliseconds elapses from the time the ball leaves the pitcher’s hand and reaches the plate. The first 175 milliseconds allows the hitter to decide if the pitch is worth swinging at. The 175 milliseconds before the ball reaches the plate gives the hitter time to decide where to swing (i.e. inside, outside, up, down). The middle 50 milliseconds is where the interesting stuff happens. This is the “decision point” as this is when the hitter has to make the choice to swing or not to swing.
Before the decision point, the hitter may be able to discern some things about the pitch, mostly about where it was released and if there’s any sign of the pitch’s type. After the decision point, the hitter, or his brain rather, is trying to project where the pitch is going to end up and how he can hit it. That 50 milliseconds in the middle is the point of no return, essentially. The hitter will do his best to pick up the pitch before the decision point and there may be some clues. The ball will keep breaking after the decision point and the hitter will do his best to track it to make contact (or take the pitch). With the neurology of hitting a baseball broken down like this, here are some things we can glean:
- Making unique pitch types look very similar before the decision point is good
- Making unique pitch types look significantly different before the decision point is bad
- Making unique pitches break significantly differently after the decision point is good
- Making unique pitches break similarly after the decision point is bad
In the “good” category, we have unique pitches that look very similarly out of the pitcher’s hand and/or break very differently after the hitter has had to make up his mind to swing or not swing. In the “bad” category, we have pitches that look differently out of the pitcher’s hand and/or don’t offer much break differential after the hitter has made up his mind to swing or not swing. These are hard things to read and write, but it aligns with our understanding. Put yourself in the hitter’s shoes — you’d much rather be able to tell early what the pitch is than have basically no idea and try to hit the ball.
So which pitch pairs are looking similar from Diamondbacks pitchers out of the hand? Which pairs are breaking far differently after the decision point? And which pairs just aren’t working? This is why we’re here, after all. We’ll rely on three of BP’s new metrics to determine which pitch pairs are good and which should be avoided.
- Release Differential: how well the pitcher mimics the same release point when throwing these two pitches
- Tunnel Differential: how similar the flight of the two unique pitches are after release, but before the decision point (i.e. how well the two pitches “tunnel”)
- Post-Tunnel Break: how much the two unique pitches “separate” or break away from one another after the decision point
With all of that out of the way, let’s look at some pitch pairs, shall we?
The Good
- Zack Greinke‘s four-seamer and changeup
- Zack Greinke’s four-seamer and slider
- Zack Greinke’s sinker and changeup
- Patrick Corbin‘s sinker and slider
The Pretty Good
- Patrick Corbin’s four-seamer and slider
- Archie Bradley‘s four-seamer and curveball
- Silvino Bracho‘s four-seamer and slider
- Rubby De La Rosa‘s four-seamer and slider
- Taijuan Walker‘s four-seamer and curveball
- Jake Barrett‘s four-seamer and splitter
The Bad
- Robbie Ray‘s four-seamer and changeup
- Braden Shipley‘s four-seamer and changeup
- Enrique Burgos‘ four-seamer and slider
- Robbie Ray’s four-seamer and slider
- Robbie Ray’s four-seamer and curveball
- Taijuan Walker’s four-seamer and splitter
- Robbie Ray’s sinker and curveball
We’ll take a closer look at these pitch pairs in a later post, but for now, let’s make some observations. Zack Greinke isn’t a velocity monster, but succeeds because hitters just can’t pick his pitches apart before the decision point and face too much break after the decision point to have wide-ranging success. Patrick Corbin does a good job of making that nasty slider look like his fastballs out of his hand, so good luck with that Dude At The Plate. Jake Barrett might really have something with that splitter… Those fastballs up in the zone for Taijuan Walker and Archie Bradley make some sense when you see how well they pair with their respective curveballs. On the flip-side, Robbie Ray’s secondaries look so much differently than his fastballs that it’s no wonder batters aren’t biting. Enrique Burgos’ slider is nasty, but hitters can see it coming. We’ve seen Taijuan Walker start going away from his splitter for his slider and this supports that approach.
Again, we’ll take a closer look at some examples here shortly.
Notes: all data from 2016, minimum 20 pairs required for each pitch pairing, statistics courtesy of Baseball Prospectus
If you enjoyed this article, please consider sharing it!


8 Responses to Which D-backs Pitches Work Well Together?
Leave a Reply
@ryanpmorrison
 Congrats to @OutfieldGrass24 on a beautiful life, wedding and wife. He deserves all of it (they both do). And I cou… https://t.co/JzJtQ7TgdJ,
 - Best part of Peralta’s 108 mph fliner over the fence, IMHO: that he got that much leverage despite scooping it out… https://t.co/ivBrl76adF,
 RT @OutfieldGrass24: If you're bored of watching Patrick Corbin get dudes out, you can check out my latest for @TheAthleticAZ. https://t.co/k1DymgY7zO,
 - Of course, they may have overtaken the league lead for outs on the bases just now, also...
But in 2017, Arizona ha… https://t.co/38MBrr2D4b,
- Prior to the games today, there had only been 5 steals of 3rd this season (and no CS) in the National League. The… https://t.co/gVVL84vPQ5,
Powered by: Web Designers@outfieldgrass24
- Starting 2022 with a frigid dog walk sounds just lovely https://t.co/xoLZSZBpGp,
- I’ll never forget seeing Kyle Seager at the Scottsdale Fashion Square one March with his family and thinking “damn,… https://t.co/uapNYdsU2a,
- Big dogs. Bigger trees. @ Avenue of the Giants, Nor Cal https://t.co/YAdxcE1t1p,
- Old friend alert https://t.co/7HQjiyBWTB,
- Death wish https://t.co/XJzcMkNPTy,
Powered by: Web Designers

This is fantastic. This question sounds stupid, but do major league teams use this data to inform game plans for pitchers? I can’t imagine any reason why our management shouldn’t be using this data to guide our major league pitchers and even adjust the development of our minor league ones.
I would assume MLB coaches would use that data in the game plan, or at least competent coaching staffs. Also your question is not stupid, it’s rather a good question to ask.
“rolled out THEIR methodology”, not “there”
another typo “Zach Greinke ISN’T a velocity monster”
Thanks Larry! This is why I don’t write on airplanes, but I was too excited not to post on this topic!
Intuitively, it doesn’t make sense that Robbie Ray’s 4 pairings are all in the bad category, yet he struck out over 200 batters last season. Are all 200 strike outs attributable to his superior fastball from a lefthander?
I wonder if the bad pairings are why Ray always has a hard time finishing off batters. He gets a lot of foul balls in two-strike counts, which really hurts his pitch counts. If the pitches look different/don’t have late break then it would make sense that batters would be making some sort of contact even if the pitch itself was good.
[…] Which D-backs Pitches Work Well Together? […]