
We all handle grief in our own ways. For me, the unceremonious trading of Brad Ziegler — as well as news later that he had signaled a willingness to sign an extension, as well as news they didn’t engage him in settlement talks, and as well as news later that other teams were shocked that the Red Sox price seemed so much lower than the price they’d been asked (Passan) — sent me back to the stats, and to some old habits that involve astonishingly long sentences. The price the D-backs extracted from the Red Sox makes it look a hell of a lot like they didn’t truly understand what they had: one of the most dominant relievers in recent memory, at a time when relief pitching typically gets its highest price (relative to value), and in a market in which other elite pitchers are in unusually short supply.
It’s probably not that simple, of course. It may be black and white thinking, but which kind? GM Dave Stewart told Nick Piecoro and Sarah McLellan a few days ago that he believed he couldn’t “put the organization in a position to not get some value back for Huddy,” in reference to having Daniel Hudson and Tyler Clippard on the market, while refusing to take offers on Patrick Corbin or Robbie Ray. As Stew explained, two weeks might not be enough time to get an extension done, which is why they started substantive talks with Hudson and Ziegler several weeks ago and having them unsigned beyond the deadline probably would mean not signing them. Hey, Stew lives under a microscope, a lot like a third base coach that knows he’ll be ripped more in a 50/50 running proposition for being aggressive and wrong than for being conservative and wrong. If you make a trade and the players don’t pan out, it might have been the players’ fault.
Did I mention that grief makes me ramble? Anyway, the D-backs’ franchise history is not long, but it’s coming up on 19 years’ worth of stats now — and Chase Field hasn’t really changed. Weird things happen to most relievers on a yearly basis, but with more than 18 years of information, we have enough to pull apart some trends. And the thing is, weird things didn’t happen to a small handful of relievers in D-backs history, depending on how you look at it. Only fifteen relievers have thrown as much as 150 innings for the D-backs, and here they are, in order of ERA.
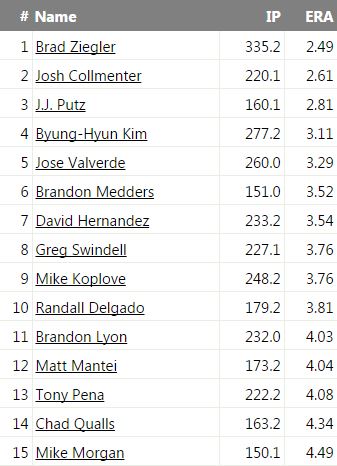 Yeah, okay, Ziegler. And yeah, Byung-Hyun Kim here is not a surprise, maybe even less so due to the 7 earned runs he yielded in 2.2 innings in his 2007 return, four years after the D-backs traded him… to the Red Sox. You remember Jose Valverde, for sure, and Brandon Medders, probably. The rest of the list is a litany of relievers who may have stuck around in uniform for too long, and maybe a lesson for why you might trade Ziegler (or Hudson or Clippard) while you could.
With one exception: J.J. Putz. Did you realize he was this good with the franchise, even including that 2014 season when the wheels came off? I don’t think I did. And I think his success where so many others have failed is truly interesting. Not too long ago, we noted that Clippard’s splitter has been really, really good for the D-backs, and that Putz was the only other pitcher who had really thrown one in uniform.
We don’t see the failures here, the relief pitchers with stuff who had results in other places, but who imploded upon impact in Arizona. Looking at successes doesn’t mean proving what will work in Arizona — but from those successes, we definitely can glean what can work. Before we get there: I want to suggest looking at this same leaderboard a little bit differently. It’s been a while since we talked about RE24, and to truly understand what’s worked here, we need to be clearer, most likely, about what we mean by success.
Success means frequently helping the team win, right? And while success is measured in wins, baseball is a game of runs, and of situations leading to runs. Some relievers are better suited to having a runner on third with less than two outs — those are the pitchers with particularly high strikeout rates. More than that: those are the pitchers who can do more to get a strikeout when they need to do that. It’s one thing to say a strikeout reliever is a good fit for strikeout situations. But which pitchers can tweak their approach to get that done? Similarly, which pitchers can tweak their approach when there are runners on first and second with just one out?
We’re dealing with a pretty good sample size here, pitchers with at least 150 innings in a D-backs uniform. I think that is a golden opportunity to work backwards from results. RE24 does that. In the 2015 run expectancy table, we see that with a runner on third and exactly one out, teams have scored an average of 0.89 runs over the rest of the inning (mostly, the runner). We also see that with no runners and no outs, the average team has scored 0.48 runs over the rest of the inning. If a reliever entered in a clean inning and leaves it with no runners scoring, he’ll get a 0.48 credit in RE24, a counting stat that adds up (or subtracts) these changes in run expectancies. If the reliever entered in a clean inning and a runner scored before he closed the inning out, he’d get a -0.52 “added” to his RE24 (the full run, minus the expected 0.48 runs). If the reliever entered in a clean inning and left it with a runner on third and one out, he’d get a -0.41 “added” to his RE24 (he increased run expectancy from 0.48 to 0.89). And if the reliever actually entered the game with a runner on third and one out, and manages to escape the inning with no run scored, he’ll get a 0.89 added to his RE24 (the run expectancy when he entered, 0.89, since no runner scored).
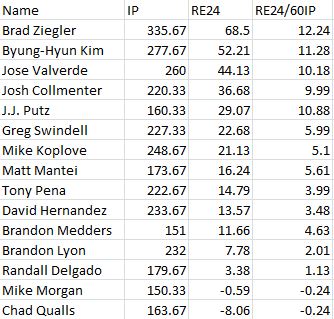 RE24 is the only fair statistic I know of for relievers. Unlike ERA, though, it is a counting stat — so if you’re a better-than-average pitcher, the more innings you have, the higher the RE24 you can pile up. I also took the liberty of turning the pitchers’ RE24 marks into a rate stat of “per 60 innings.”
We’ve got some chaff among these relievers, guys who were merely average in Mike Morgan and Chad Qualls and Randall Delgado and Brandon Lyon, some guys who were strengths without being great, like Greg Swindell, Mike Koplove, Matt Mantei, and Medders — and a couple guys in between in Tony Pena and David Hernandez. We’ve got some wheat, though, too, and it’s not just Ziegler. Averaging around 10 RE24 per 60 innings would mean averaging in the top 30 among all MLB relievers on a yearly basis. Ziegler, Kim, Valverde, Josh Collmenter, and Putz.
Category 1: Guys Who Keep the Ball Outta The Outfield
Once again, Brad Ziegler is on top. And, to be fair, since twin killings were squarely in his wheelhouse, putting him on the same per-60 IP footing as the other relievers maybe sill devalues his true contribution — he gets more outs (and more IP) with a fewer number of pitches. Still, 12.24 of RE24 would be a very good season for any reliever, and that includes what was a very down year for Ziegler in 2014, when he posted a 3.49 ERA en route to offseason knee surgery. Ziegler’s full season RE24 totals with the D-backs were 19.37, 16.28, -0.50, and 19.96 — and he’s well on his way this year (7.42 RE24). For context, only three relievers had a higher RE24 last year than Ziegler: Wade Davis, Dellin Betances, and (wince) Will Harris. And he did it pitching for Arizona.
Last October, I wrote a piece on trying to make more Zieglers out of washing-out pitcher prospects, an organizational technique or philosophy that goes back to the franchise’s Buck Showalter roots. There are two benefits to trying to make more Zieglers: one is having more good relievers, and the other may be having good relievers of a type that works at Chase Field and in the NL West, as all five teams in the division play their home games in large outfields — and yet the D-backs nonetheless still play more than half of their games in parks that are at least somewhat homer-friendly.
What does it mean that both of this franchise’s best relievers threw from a low arm angle? Ziegler kept up a ridiculous 69.3% ground ball percentage, and while his home run to fly ball ratio wasn’t actually all that low, yielding few fly balls did mean he had a low home run rate overall. Unfortunately, we don’t have good batted ball data for a lot of Kim’s tenure with the D-backs, but what we do have does show him to be grounder-leaning (53% GB%). He made up for that, it seems, with a fantastic strikeout rate: 11.2 K/9 over his 277.2 innings for Arizona. Kim managed both things, although for Ziegler, it seemed like more of an either/or proposition.
If we pretend that all line drives go to the outfield just for illustration purposes, then Ziegler let just 23.3% of hitters hit a ball into the outfield (others hit grounders, walked or struck out), and Kim worked out similarly — 27.7% of batters hit a fly ball or line drive. For the sake of comparison: Randall Delgado, who has been slightly better than average for a team that has a hard time finding relievers even that good, has had 38.7% of batters hit a fly ball or line drive.
Ground balls, strikeouts, or a hearty combination of the two: that kills more than anything at Chase Field. And Ziegler and Kim aren’t the only relievers to have shown us that. When Evan Marshall had his spectacular 2014 season, he smushed Ks and GBs together to allow just 26% of hitters to hit a fly ball or line drive; in his mediocre 2015, that number rose to 37.7%.
Category 2: Josh Collmenter
Yeah, I got nothing here. Collmenter is a flat out good pitcher, and I think there’s good reason to think he could do good bullpen work for anyone, anywhere, at least until the velocity falls so dramatically that it’s like having a coach flip you balls for the fungo. But if he’s been immune from Chase Field, it’s got to be that his fly ball rate (while not extreme) is still high enough to take advantage of Chase’s large confines — and part of his pitching genius is in making it hard for hitters to barrel him up, by having movement so freaking vertical that hitters just aren’t used to doing anything with it. By using a cutter as his primary fastball and somehow making it so that his change has little to no horizontal movement, Collmenter gives hitters an up/down look that they just haven’t seen before, one which almost definitely looks more jarring with that release point and because he’s not the first live pitching they’ve seen that day.
To the extent it’s about release point and to the extent release point is about capitalizing on being different, then what makes Collmenter good or bad isn’t necessarily something having to do with batted balls in the first place. His brand of pitching could just be different, and I’m not sure there’s a way to simulate that. I would note, though, that there is a bigger trend of weird arm angles here, if we just look at them as “weird” and not as “high” or “low.” Ziegler was submarine, Kim was sidearm, and Collmenter is something we don’t really have a similar name for (oh, he’s an “over the topper”). But J.J. Putz also had a strange arm angle, one that leveraged a ton of height — he released the ball about 6’7″ off the ground, higher than the normal 6’2″ or so we get from most pitchers, but nowhere near as high as Collmenter, who gets up over 7’7″. The difference: whereas Collmenter is almost directly overhead, Putz managed his 6’7″ release point while also releasing the ball over 2.5 feet to the right of the center of the rubber, exactly as much from the side as Brad Ziegler threw at a much different vertical level. Weird, right? So maybe there’s something to that.
Category 3: Splitter Throwers
Yes, Putz threw splitters. But so did Jose Valverde! Sadly, league-wide PITCHf/x data begins only in 2007, Valverde’s final season with the D-backs, so I can’t tell you for sure what he was throwing throughout his tenure. But in his last season for the team, Valverde only threw his fourseam fastball (75.1%) and splitter (24.7%) — nothing else. And that’s the way things continued for Valverde, until his career drew its last major league breath for the Mets in 2014. In the years following Arizona, Valverde threw that splitter 24.9% of the time (2008), 30.8% (2009), and even more often than his fourseam one season, 52.1% (2010), when he threw 63.1 innings for the Tigers. Yow!
There’s nothing unusual about Valverde’s release point, not really; but there is something a little unusual about Valverde’s fourseam fastball, which averaged more rise than average in his last D-backs season (9.9 inches) and beyond. J.J. Putz: also right around that mark with his fourseam (10.0 in 2012). And while Putz threw nearly as many sinkers as he threw fourseam fastballs, and while he also mixed in the occasional slider, Putz’s main secondary pitch was, again, that splitter (22.5% in 2012).
There are so few splitter throwers in today’s game; Clippard is one, and like Putz and Valverde, he has a high-rising fastball (even higher — he’s averaging 11.6 inches of vertical movement this year). The way the pitch is classified at Brooks Baseball by Pitch Info, only 36 pitchers have thrown as many as 50 splitters this season. Only 139 have thrown as many as 100 since PITCHf/x data began in 2007, and that includes quite a few guys who clearly just toyed with it, like Brandon McCarthy, who never actually got hitters to swing at it a reasonable percentage of the time. On the overall leaderboard, Valverde has the 24th-highest total of splitters thrown (1,795), and Putz, the 41st (1,189).
I don’t know why this splitter thing appears to work, but maybe instead of being immune from Chase Field and the other large outfields, it actually benefits from them in some way. Is it the combination with the rising fastball? Because that also seems like an awful weird coincidence. But even if you include Clippard in this category, we haven’t covered everyone in the Great Canon of D-backs Starters. Curt Schilling threw a splitter, although I have no idea how often he threw it while with the D-backs; his final season was also the first season of PITCHf/x, and he threw it as his featured secondary pitch, 22.6% of the time. And Schilling had a high-riser, with 11.5 inches of vertical movement in 2007 (and I think we all recall how his fastball used to explode when he was in his prime).
And Dan Haren. With the benefit of hindsight, Haren’s 3.33 ERA season with the D-backs in 2008 after pitching to a 3.07 ERA for Oakland looks like a god damned miracle. He bettered that in 2009, with a 3.14 ERA in even more innings (229.1). Things took a turn for the worse in 2010, but really, Haren’s two full years of pitching for Arizona are one of the best stretches we’ve ever seen from a D-backs pitcher. And guess what: the dude threw a high-rising fastball (10.8 inches in 2008, 11.4 inches in 2009), and… a freaking splitter, although it was less a featured pitch and more a favorite jigsaw in Haren’s fourseam/sinker/cutter/curve/split toolshed. That list of PITCHf/x splitters, the one that ranked Valverde 24th and Putz 41st in terms of total thrown? Haren is fourth on that list, with 3744 tracked splitters.
Do you have an explanation for this, and why it works? I’ll keep thinking, but I don’t know why that approach would be a good fit for Chase, beyond what I noted in reference to Clippard. But think about our pitching titans.
- Randy Johnson: Weird, huge arm angle (like Putz, his release point was about 2.5 feet from center of rubber while also being high), also kept the ball out of the outfield with huge strikeout numbers.
- Curt Schilling: Kept the ball out of the outfield with huge strikeout numbers; also was a riser/splitter guy.
- Byung-Hyun Kim: Kept the ball out of the outfield.
- Brandon Webb: Kept the ball out of the outfield like a mofo, more strikeouts than Ziegler, more ground balls than Kim.
- Jose Valverde: Riser/splitter guy.
- Dan Haren: Riser/splitter guy.
- J.J. Putz: Riser/splitter guy, who maybe also had a weird arm angle.
- Brad Ziegler: Kept the ball out of the outfield like a mofo.
- Josh Collmenter: a Josh Collmenter guy.
Am I missing anyone? Could it really be this simple?
If you enjoyed this article, please consider sharing it!


5 Responses to What Makes a Good D-backs Reliever?
Leave a Reply
@ryanpmorrison
 Best part of Peralta’s 108 mph fliner over the fence, IMHO: that he got that much leverage despite scooping it out… https://t.co/ivBrl76adF,
  RT @OutfieldGrass24: If you're bored of watching Patrick Corbin get dudes out, you can check out my latest for @TheAthleticAZ. https://t.co/k1DymgY7zO,
 - Of course, they may have overtaken the league lead for outs on the bases just now, also...
But in 2017, Arizona ha… https://t.co/38MBrr2D4b,
- Prior to the games today, there had only been 5 steals of 3rd this season (and no CS) in the National League. The… https://t.co/gVVL84vPQ5,
- RT @OutfieldGrass24: Patrick Corbin has a WPA of .318 and it's only the fifth inning.,
Powered by: Web Designers@outfieldgrass24
 RT @joshuamckerrow: 1. Today I did the annual story on holiday decorations at the Governor's residence. I've done it every year, for ye… https://t.co/s7JnlHM1RO,
 - This Suns matchup comes at a good time for my hometown Blazers #RipCity https://t.co/fQ45wdfQUk,
 RT @ZHBuchanan: Our @Ken_Rosenthal spoke to Ken Kendrick about trading Paul Goldschmidt.
https://t.co/O5fHRlyBxD,
RT @ZHBuchanan: Our @Ken_Rosenthal spoke to Ken Kendrick about trading Paul Goldschmidt.
https://t.co/O5fHRlyBxD,  RT @CardsNation247: We have a good show lined up for tonight. Leading off is our friend of the show @buffa82 followed by Jeff Wiser… https://t.co/eltZC0uvyg,
  RT @juanctoribio: To piggyback off the @ZHBuchanan and @OutfieldGrass24 that the #Rays were involved in the Paul Goldschmidt sweepsta… https://t.co/spg9x7X1L5,
Powered by: Web Designers

The split-finger is something that has always seemd to thrive well here. It has been hard to tell if it was because of how good those pitchers were in general (Johnson, Schilling, Putz, Haren) or if it was because of how well it plays in Chase Field with the big space.
With all the talk of Archie Bradley needing to learn another pitch, it has always seemed odd to me that given his fram, they haven’t tried to teach Bradley to use a splitter. He seems like he would be a prime candidate for the pitch, given his current fastball tendencies. The splitter would work well with the change and the fastball, and might lessen the blow of having a sub-par change.
With the Diamondbacks focusing on kinds of pitchers, splitty users are ones I would like to see them target more often.
can’t believe olsen didn’t make the list.
If you’re going to include single seasons from starters, what did Ian Kennedy and Hudson do in 2011? Corbin in his rookie year?
[…] than I did three years ago, but other than fitting many of the team’s success stories into three fairly specific categories, all I really can point to is that swing-and-miss profile, and there’s no way to remake the […]
[…] does and doesn’t work in Phoenix, and Hellickson is a lesson already learned. It’s just a short list of pitching attributes that translates for Arizona, and with high strikeout rates both expensive and unavailable, there isn’t a lot of room to […]