
Last week in setting a benchmark for wins needed from the rotation, I used a placeholder for wins we could expect from the bullpen: about 2.5 above replacement. It was intended to be conservative, but if this season is any guide, the bullpen could be quite a lot better than catch-all statistics like Wins Above Replacement would indicate. As of yesterday, the D-backs were 17th in the majors in fWAR, coming in at 2.1. It looks to me like the bullpen is not slightly below average after all — in fact, it’s well above average, by at least some metrics that may be more appropriate.
Above average as in fifth in the majors. It’s been a while since we’ve talked about the use of RE24 to measure performance from relievers, but I’m not picking this out of a hat right now for the sake of finding controversy; I think I’m on record several times as saying that RE24 isn’t just my metric of choice for relief pitchers, but the only one that does a vaguely fair job.
ERA makes some sense with respect to starting pitchers, who always come in with a clean inning, and who exit mid-inning infrequently (among all their innings). Teams score an average of .47 runs per inning with three outs, but if innings were changed to two outs, that wouldn’t be reduced by a third; it’d be reduced by nearly half (.25 runs per inning). Just one out an inning, and the reduction is even more stark (.10 runs per inning).
When a relief pitcher comes in to get the last out of an inning, he’s on easy street, as far as ERA is concerned. Any runners on base are charged to previous pitchers, so they can’t hurt him at all (in fact, they help a little bit, as they can also be outs). Instead of being exposed to one-third of a normal run scoring environment (1/3 of .47 runs per inning would be .16 per out), he’s going to get fewer runs scored (37.5% less) just by having average overall success in that situation. ERA is unfairly nice to pitchers who frequently come in mid-inning, mostly for that reason.
But it also doesn’t really capture their value. Brad Ziegler, for example, is excellent at inducing double plays. Sometimes, he’s been brought in for double play situations, and the lead runner isn’t charged to him. If he happens to be more efficient than the average pitcher at erasing that runner, and if he does so with the bases loaded and one out, he gets credit for two thirds of a clean inning, but no credit at all for preventing the other runners from scoring.
We used a recent Run Expectancy table to calculate some baserunning break even rates a bit ago, and that has more of an explanation of how run expectancy works. Suffice it to say, we know based on enormous, recent samples how many runs score on average in each of the 24 base-out states (zero through two outs, eight different baserunner situations). RE24 uses the Run Expectancy for each of those 24 states as the starting point for a pitcher’s entry into the game, and uses the differences to figure out how much the pitcher helped (or hurt) the team.
You can also turn those RE24 marks into wins totals, using the average run differential needed to gain one game in the standings. “REW” is keyed to averages, so if you added up every pitcher’s total, you’d get zero. That makes it a little different than fWAR, which is based on replacement level. Still, a simple comparison of ranks (17th in fWAR, 7th in REW) tells us that the D-backs are probably undervalued by fWAR, and that it’s ill-suited to measure them.
Despite sticking with fWAR for the rest of the team, then, I’d propose we move in a different direction for D-backs relievers. This is why:
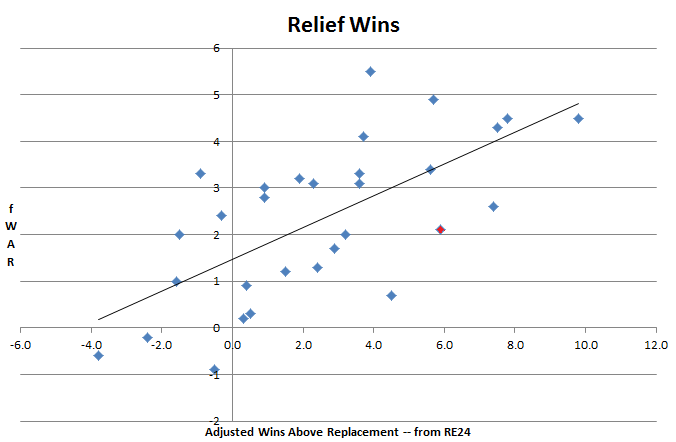
What I did here was take all of the wins above replacement from fWAR and divvy them up among team totals according to total innings pitched. This isn’t reinventing REW, which is exactly what it should be already; it was just a way to illustrate the difference between REW and fWAR for each relief crew. If I just told you the D-backs’ REW was 3.24 and their fWAR was 2.1, it doesn’t seem like a big difference; but because the average REW is just a hair above zero (relievers being a tad more effective than starters) and the average fWAR among the 30 teams is 2.3, the difference is much more significant than it appears at first blush.
You guessed it; the red diamond is the Diamondbacks. Generally speaking, if a dot is below the line, fWAR has been harsher than it should be, according to RE24. The D-backs are kind of an outlier here, in terms of the total difference, but also proportionally. The Giants (down and to the left) have been much more effective than their FIPs would suggest, and the Pirates (just to the right of the D-backs) have also not gotten credit commensurate with their skill in preventing runs.
If you look at the graph differently, purely as a function of how “right” each team is on the x-axis, the D-backs bullpen has had the fifth-highest value among teams. They get a bit of a bump beyond their 7th-place RE24 rank because it’s a little more valuable to sustain their 29.52 RE24 kind of success over 424.1 IP than it is to total 30.64 RE24 over 380.2 (Orioles) or 31.70 RE24 over 358 IP (Blue Jays). The basic idea with above-replacement statistics would have us add negative RE24 totals to the Orioles and Blue Jays totals to make up the very significant gap in innings. You can pick your poison, but staying so positive while tallying the majors’ highest innings total is worth a lot.
The cool part: we don’t need to assume that the D-backs will need to cover such a ridiculous innings total with relievers next season. And while that probably doesn’t mean losing replacement-level performances (there are several), it does probably mean that a higher proportion of the D-backs’ relief innings next year will come from better relievers.
| Name | RE24 | REW | WAR | Relief-IP | ERA | FIP |
| Brad Ziegler | 16.75 | 1.73 | 0.3 | 53.1 | 1.52 | 3.57 |
| Andrew Chafin | 13.87 | 1.5 | 0.9 | 64.1 | 2.24 | 2.84 |
| Josh Collmenter | 8.17 | 0.9 | 0 | 32 | 1.69 | 4.15 |
| Randall Delgado | 5.25 | 0.54 | 0 | 50 | 2.7 | 4.14 |
| J.C. Ramirez | 3.38 | 0.38 | 0.1 | 15.1 | 4.11 | 3.32 |
| Vidal Nuno | 2.68 | 0.3 | 0.3 | 14.1 | 1.88 | 2.42 |
| Oliver Perez | -0.61 | -0.03 | 0.3 | 29 | 3.1 | 3.02 |
| David Hernandez | -0.66 | -0.06 | -0.1 | 22.1 | 3.63 | 4.51 |
| Evan Marshall | -0.69 | -0.1 | -0.4 | 13.1 | 6.08 | 6.12 |
| Daniel Hudson | -0.7 | -0.04 | -0.1 | 50 | 4.14 | 4.2 |
| Addison Reed | -2.83 | -0.25 | 0.6 | 39.1 | 3.89 | 3.17 |
| Enrique Burgos | -5.06 | -0.52 | 0.3 | 21 | 5.14 | 2.88 |
These are just the relievers with at least 10 innings pitched (I know you’re curious, so: Keith Hessler has a -7.54 RE24 — almost a win’s worth of runs below average in 5.1 IP!). I don’t know about you, but even just looking at it, RE24 (and REW) seem to do a much better job of valuing these guys than does FIP, and by extension fWAR. Where FIP isn’t sensitive to the ground balls of Brad Ziegler and pegs him as a middling arm, both ERA and RE24 cause him to shine. Andrew Chafin is not only a monster with things measured by FIP, but also with things it doesn’t measure; he has been nearly as important as Ziegler.
Some small-sample strong performances by J.C. Ramirez and Vidal Nuno help buoy the team’s RE24 totals, but for the most part, this is a bullpen full of average relievers, standouts in Josh Collmenter (as a reliever!), Ziegler and Chafin, and a couple of less successful ones in Enrique Burgos and Addison Reed (who, by virtue of strikeouts, are guys that FIP loves). Get far above average in a couple slots without losing much ground in others, and you have yourself an above average bullpen.
Chafin’s performance is very exciting, but not much more so than Evan Marshall’s last year, a good reminder that we’re dealing with a ton of uncertainty next season. Still, Ziegler is back and Chafin is back; their REW totals alone, if repeated, tell us that we might be able to count on more than 2.5 wins from this relief crew next year (and, again, REW is based on average being zero, not replacement being zero).
The Baseball-Reference version of WAR has Ziegler at 2.1 bWAR and Chafin at 1.7 bWAR… already at 3.8 wins combined, with some 40 games to go. If they can stay in that neighborhood next season, and if the team either adds another standout reliever or manages to be average overall beyond Ziegler and Chafin, we may be able to count on as much as 4 wins of value from next year’s bullpen. That’s 1.5 more than the placeholder used last week. Considering we were also fairly conservative with the position player marks, that may be enough to re-open the debate about the upgrades needed in the rotation in order to reach the playoffs next season.
If you enjoyed this article, please consider sharing it!


12 Responses to Arizona Bullpen Much Better Than Advertised
Leave a Reply
@ryanpmorrison
 Best part of Peralta’s 108 mph fliner over the fence, IMHO: that he got that much leverage despite scooping it out… https://t.co/ivBrl76adF,
  RT @OutfieldGrass24: If you're bored of watching Patrick Corbin get dudes out, you can check out my latest for @TheAthleticAZ. https://t.co/k1DymgY7zO,
 - Of course, they may have overtaken the league lead for outs on the bases just now, also...
But in 2017, Arizona ha… https://t.co/38MBrr2D4b,
- Prior to the games today, there had only been 5 steals of 3rd this season (and no CS) in the National League. The… https://t.co/gVVL84vPQ5,
- RT @OutfieldGrass24: Patrick Corbin has a WPA of .318 and it's only the fifth inning.,
Powered by: Web Designers@outfieldgrass24
 RT @JCGonzalezOR: Special thanks to @HillsboroHops for hosting a LatinX community outreach and visioning session. This organization i… https://t.co/OxmEgwOpEh,
 - Old friend alert https://t.co/xwSHU0F8Hn,
- Every once in a while you get a beer that's just a little off... Usually happens to me at airports.,
- If Pollock doesn’t sign with a team that wears red uniforms I’m going to be really disappointed. Working theory: Se… https://t.co/zHn9DqzEiD,
- The work here by @Britt_Ghiroli is splendid https://t.co/c8tSq0vw3T,
Powered by: Web Designers

Excellent. I’m never looking at FIP or fWAR again when evaluating relievers. Knew they weren’t great, but this chart shows just how misleading they can really be.
man i wish i was an analytical as youse guys. Sometimes learning this stuff and going thru it is like taking castor oil.
great work as usual though.
Thanks! RE24 is about as far as we’d go on a regular basis, I think, but part of it for us is trying to know the right tools at the right time (trying, anyway). Here, I think it’s pretty clear that the bullpen hasn’t gotten enough credit.
Pretty glad that the team held onto Ziegler.
Thanks for the great stuff as always. Your “D-backs Rotation” piece has been in the back of my head since I read it. I feel the team shouldn’t just be trying to reach some magical WAR number but rather building the best team possible. I fear using an argument that the team only needs to add a pitcher providing x-WAR value runs the risk of becoming an argument to spend less. This piece does a great job of showing that the bullpen is not a problem but rather an asset. The offense and defense are obviously strong pieces. The glaring TOR hole that this team has had since we lost Webb needs to be filled this off-season and not using a minimum acceptable WAR value to save money. I love using WAR to identify strengths and weaknesses. It can be very useful when comparing the relative worth of players. Where I worry is when it’s used to justify signing Mat Latos over David Price because Latos provides enough WAR to reach the on paper total.
oh, absolutely, I completely agree.
Since we’d have variation in individual performance AND injuries AND the luck that comes along with WAR actually matching win totals… we’d be much better off talking about this in terms of the percentage chance that certain likely WAR totals turn into a playoff appearance.
Tough nut to crack. Once we get 2016 projections, maybe we’ll be equipped enough to handle that. But in your Latos/Price example, if Latos brought a WAR total we thought meant a 50/50 shot of the playoffs, maybe that’s not good enough anyway.
[…] a mere 4.86 innings per game, leaving the bullpen way too many messes to clean up. And while Ryan had some thoughts on the true quality of the bullpen, they’re just not equipped to handle this kind of workload. They’re having to soak up […]
[…] average team, if only because the team is so deep in fairly solid or near-solid pitching. When we examined the bullpen using RE24 (why use anything else!), just Brad Ziegler and Andrew Chafin stood out as above average (and they […]
[…] D-backs bullpen generally in mid-August, finding that the staff’s relievers had actually been quite good. Using RE24 — the only statistic I really trust for major league relief performance — […]
[…] RE24, the only statistic I really trust to evaluate just how valuable a reliever really is, Brad Ziegler was the 4th-best reliever in all of baseball last year (just behind 3rd place Will […]
[…] the bullpen. Thing is, toward the end of the season, it looked like the D-backs actually did have a good relief crew, meaning extra guys probably won’t help unless they’re Guys. And for planning purposes, […]
[…] to just Josh Collmenter on the team. But ERA is ill-equipped to measure the value of relievers. Per RE24, a counting stat that compares run expectancy from when a reliever comes in a game to how he leaves […]